The below charts provide a breakdown for each survey question on the ServiceNow Salary Influence Survey 2020. Each chart indicates the percentage of the responding population that selected a particular response for the given question. Some questions were omitted from this summary due to the risk of revealing identifying information. Questions omitted from this summary were still used in the analysis of the data to produce the final results.
Contents:
Age Gender Ethnicity Disability Status In what geographic location are you employed? [US State] In what geographic location are you employed? [India Province] In what geographic location are you employed? [Country] In what geographic location are you employed? [Continent] In what geographic location are you employed? [Bureau of Economic Analysis Region] Are you a military veteran? Do you identify with the gender majority of the team(s) with whom you most closely work? Do you identify with the ethnic majority of the team(s) with whom you most closely work? Do you identify with the cultural majority of the team(s) with whom you most closely work? Do you identify with the socioeconomic majority of the team(s) with whom you most closely work? Do you identify with the religious majority of the team(s) with whom you most closely work? Is your first language the preferred language of the team(s) with whom you most closely work? What is the highest level of education that you completed? If you attended college, what was your field of study? Please indicate the total years of experience you have in the following areas [Total Professional Experience] Please indicate the total years of experience you have in the following areas [In the IT Field] Please indicate the total years of experience you have in the following areas [Working with the ServiceNow Platform] Please indicate the total years of experience you have in the following areas [With your current employer] Please indicate the total years of experience you have in the following areas [In your current role] How many different employers have you worked for in your career? Please select any ServiceNow certifications that you currently possess Please select any ServiceNow micro-certifications that you currently possess Please select any Professional certifications that you currently possess Survey Responses by Total Number of Certifications Survey Responses by Total Number of Mainline Certifications Survey Responses by Total Number of Micro-Certifications Survey Responses by Total Number of CIS Certifications What is your current employment status? Which of the following best describes your current job role? Which of the following best describes your job level? What percent of the time do you typically spend working remotely (before the COVID-19 Pandemic)? How many hours do you work in a typical work day? For each of the following skills, please select the highest frequency at which you typically use the skill on the job. For each of the following ServiceNow products, please indicate the highest frequency with which you perform work related to the product in your current role. Please rate the degree to which you agree with the following statements Please rate the degree to which you are satisfied with the following Are you currently paid Salary or Hourly?
Age
Survey Responses by Age
Response
Percent of Respondents
18-24
5.22%
25-34
60.00%
35-44
24.35%
45-54
9.57%
55+
0.43%
Prefer not to disclose
0.43%
Gender
Survey Responses by Gender
Response
Percent of Respondents
Male
79.57%
Female
17.39%
Prefer not to disclose
2.61%
Non-binary
0.43%
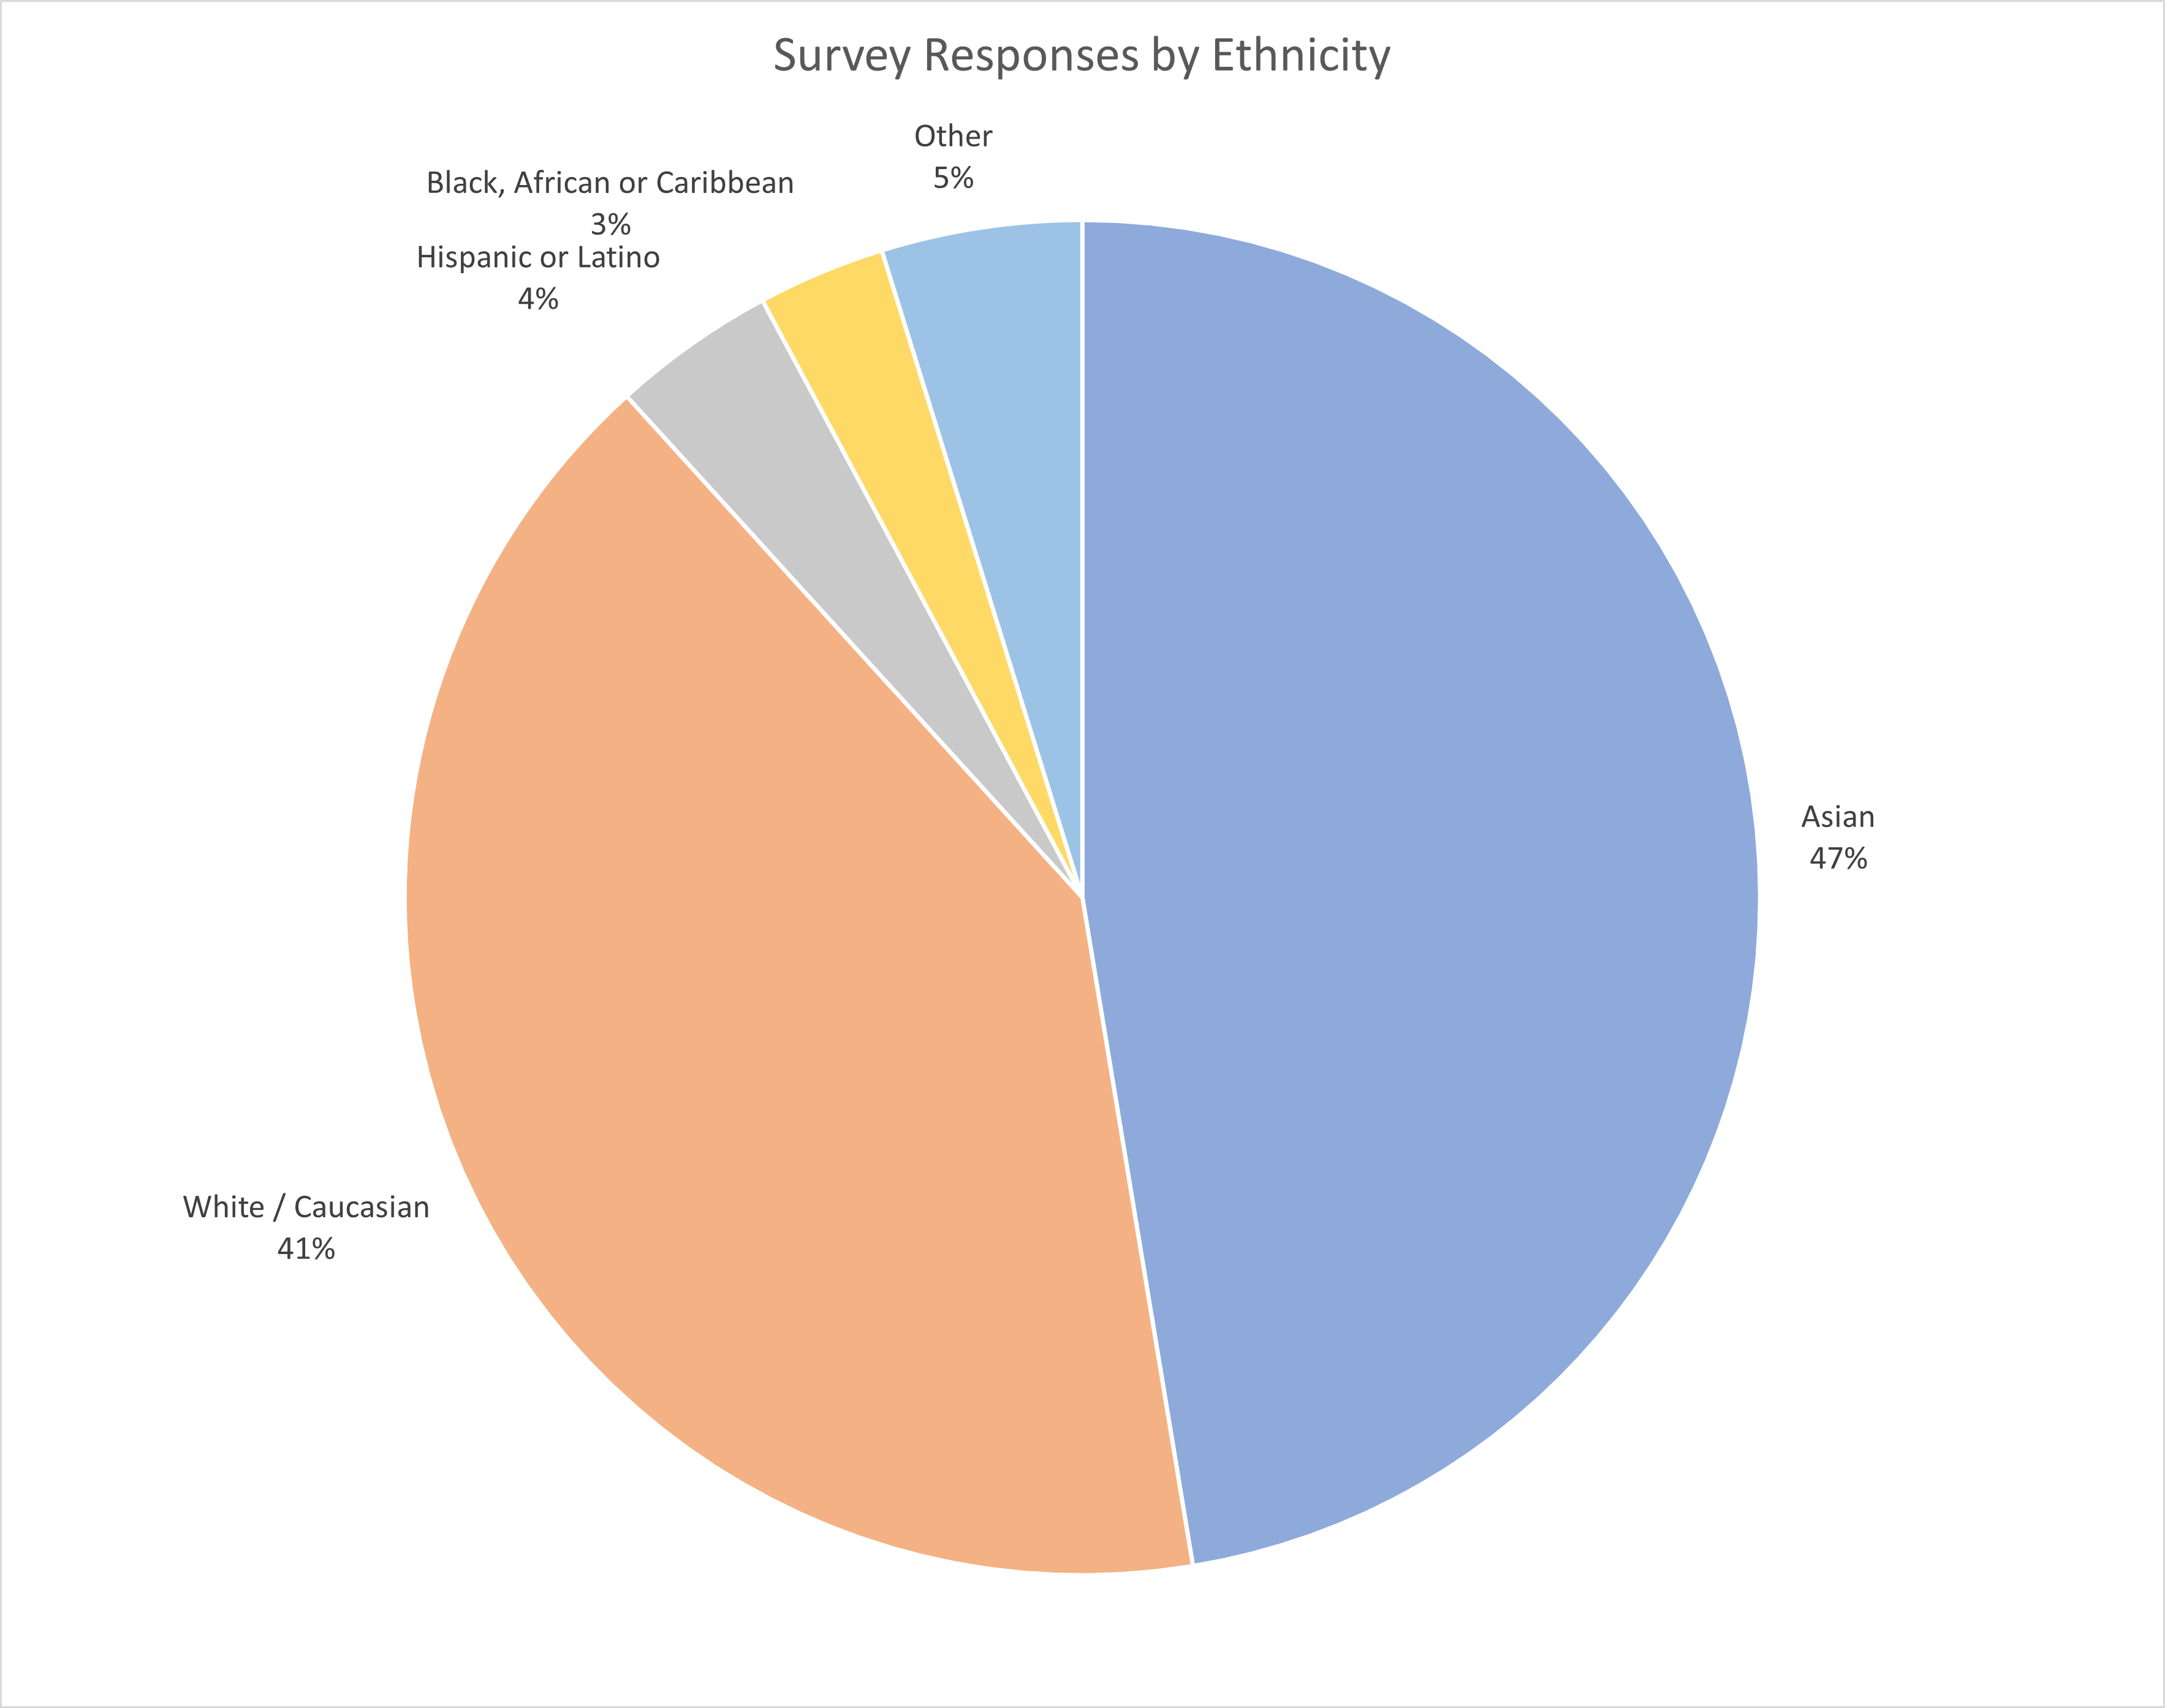
Ethnicity
Survey Responses by Ethnicity
Response
Percent of Respondents
Asian
47.39%
White / Caucasian
40.87%
Hispanic or Latino
3.91%
Black, African or Caribbean
3.04%
Prefer not to disclose
2.61%
Arab
0.87%
Native American
0.87%
Mixed / multiple ethnic groups
0.43%
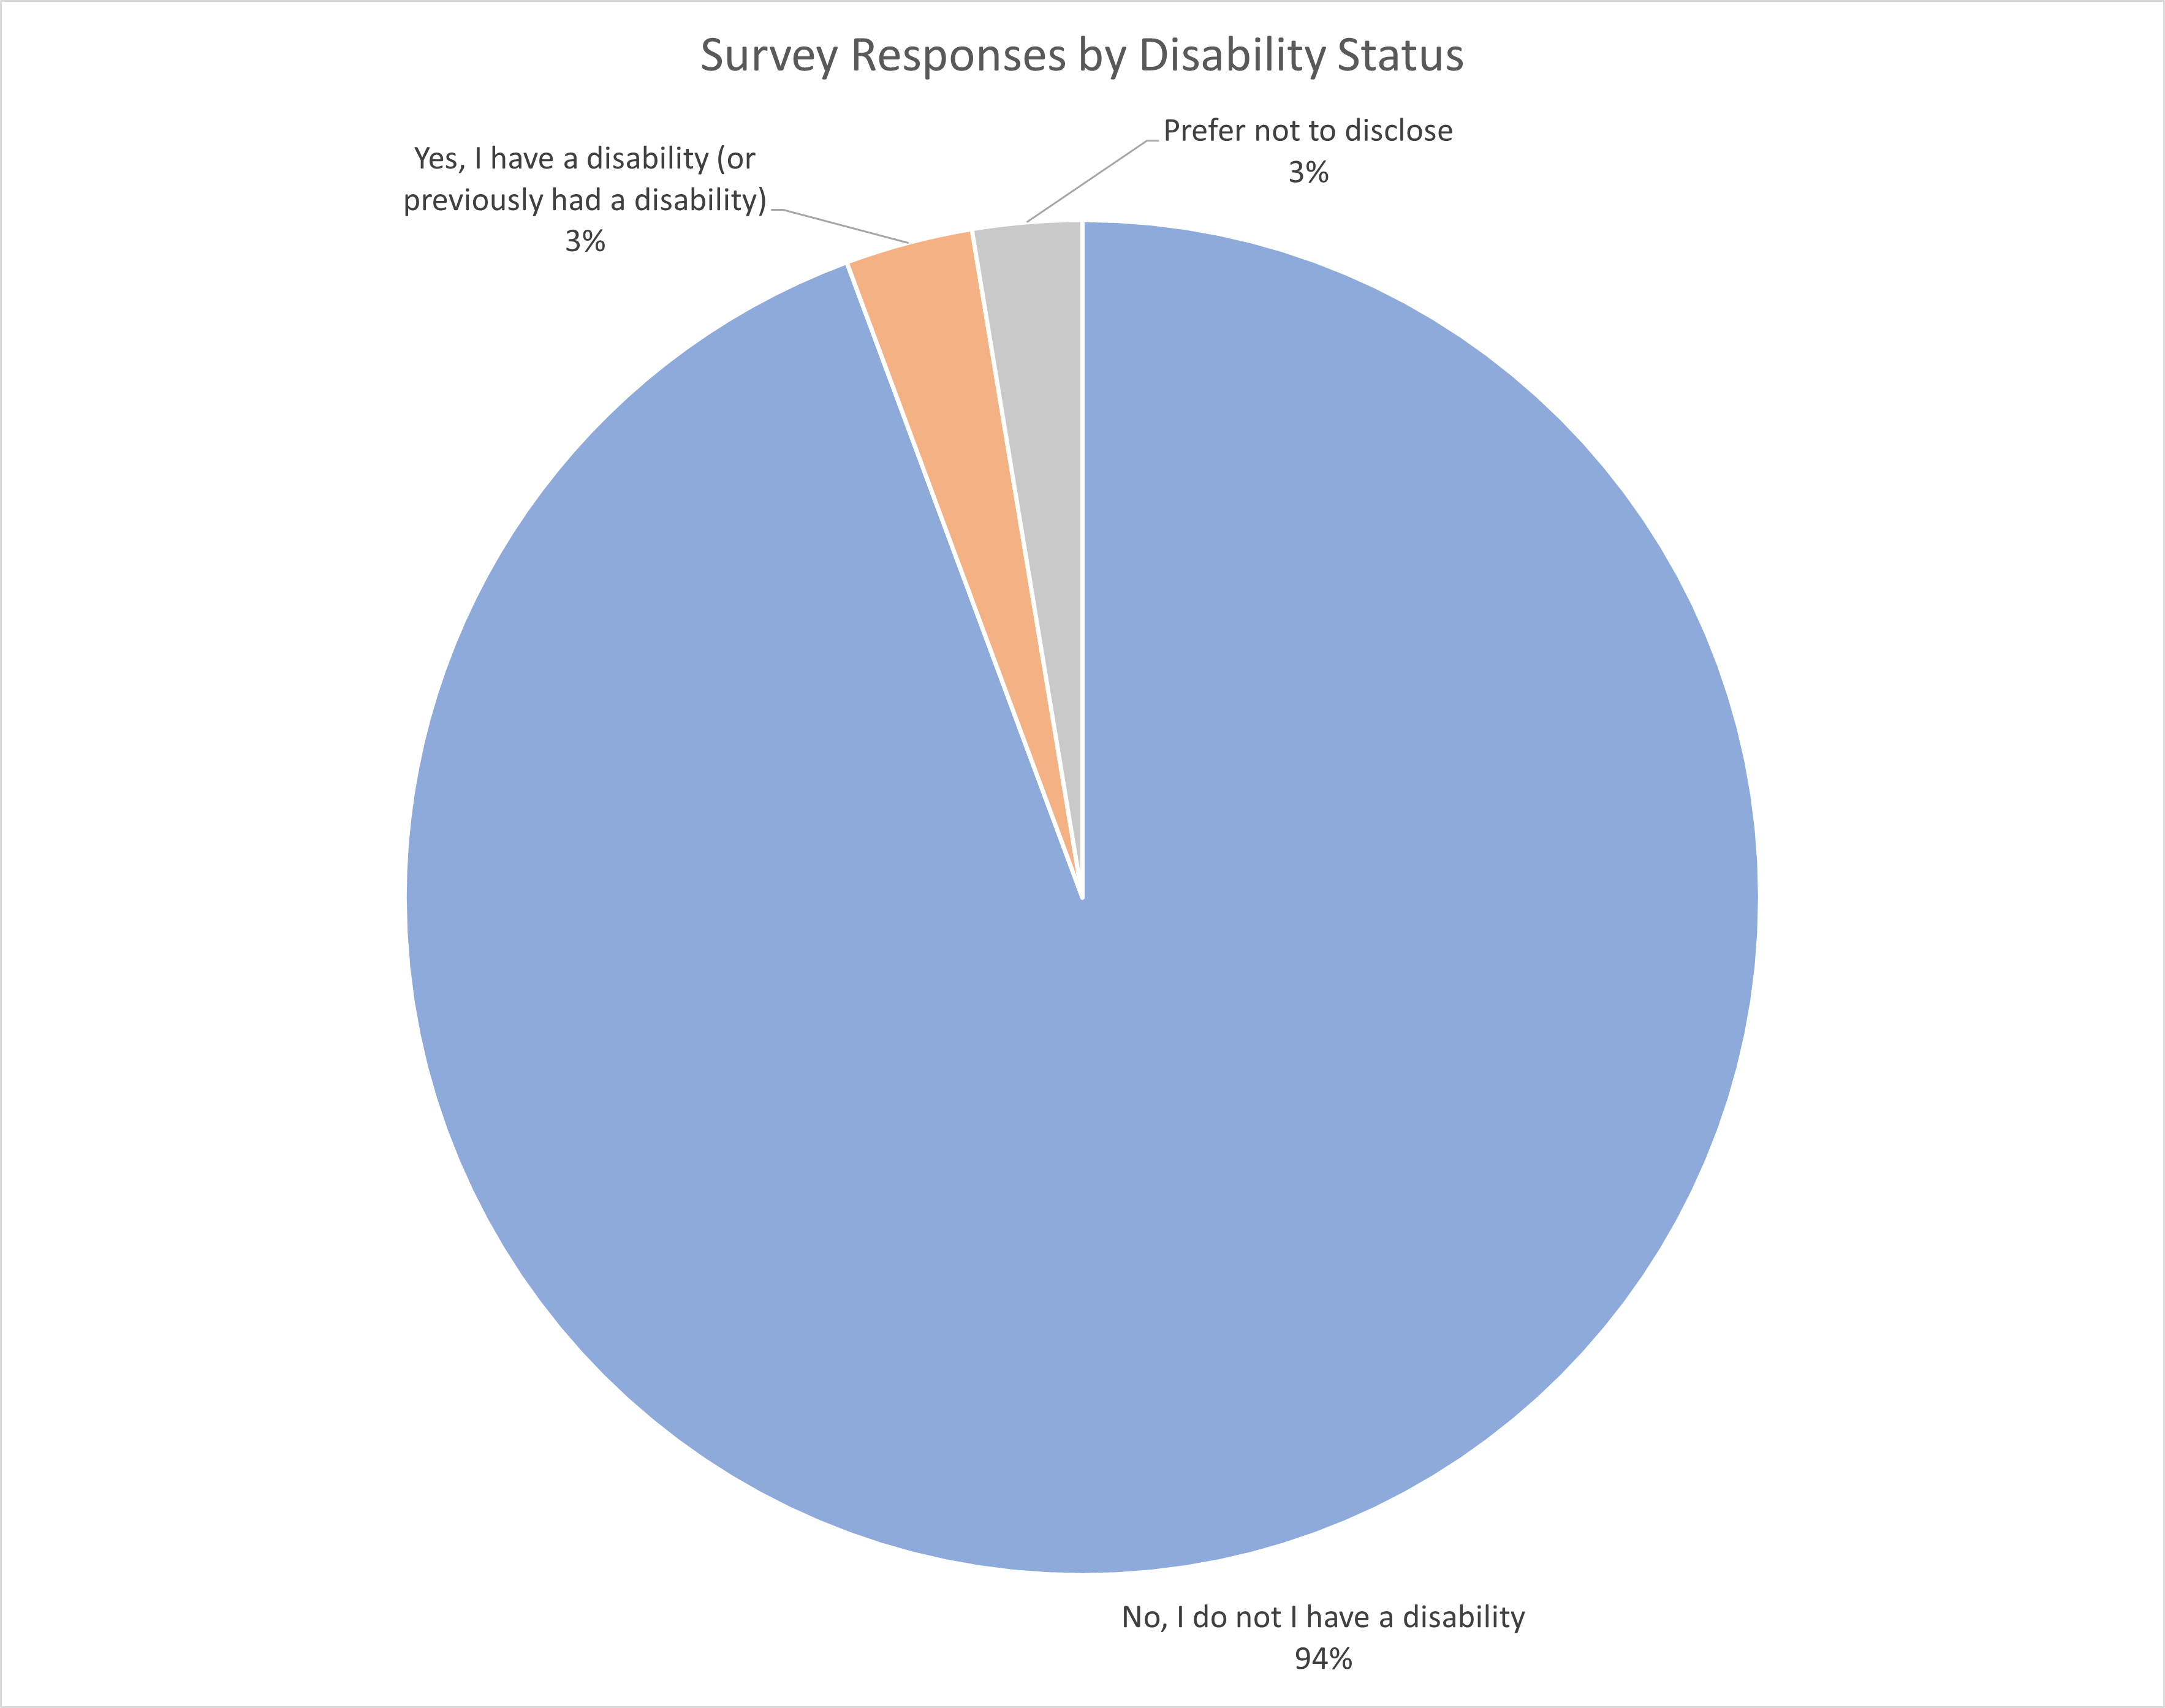
Disability Status
Survey Responses by Disability Status
Response
Percent of Respondents
No, I do not I have a disability
94.35%
Yes, I have a disability (or previously had a disability)
3.04%
Prefer not to disclose
2.61%
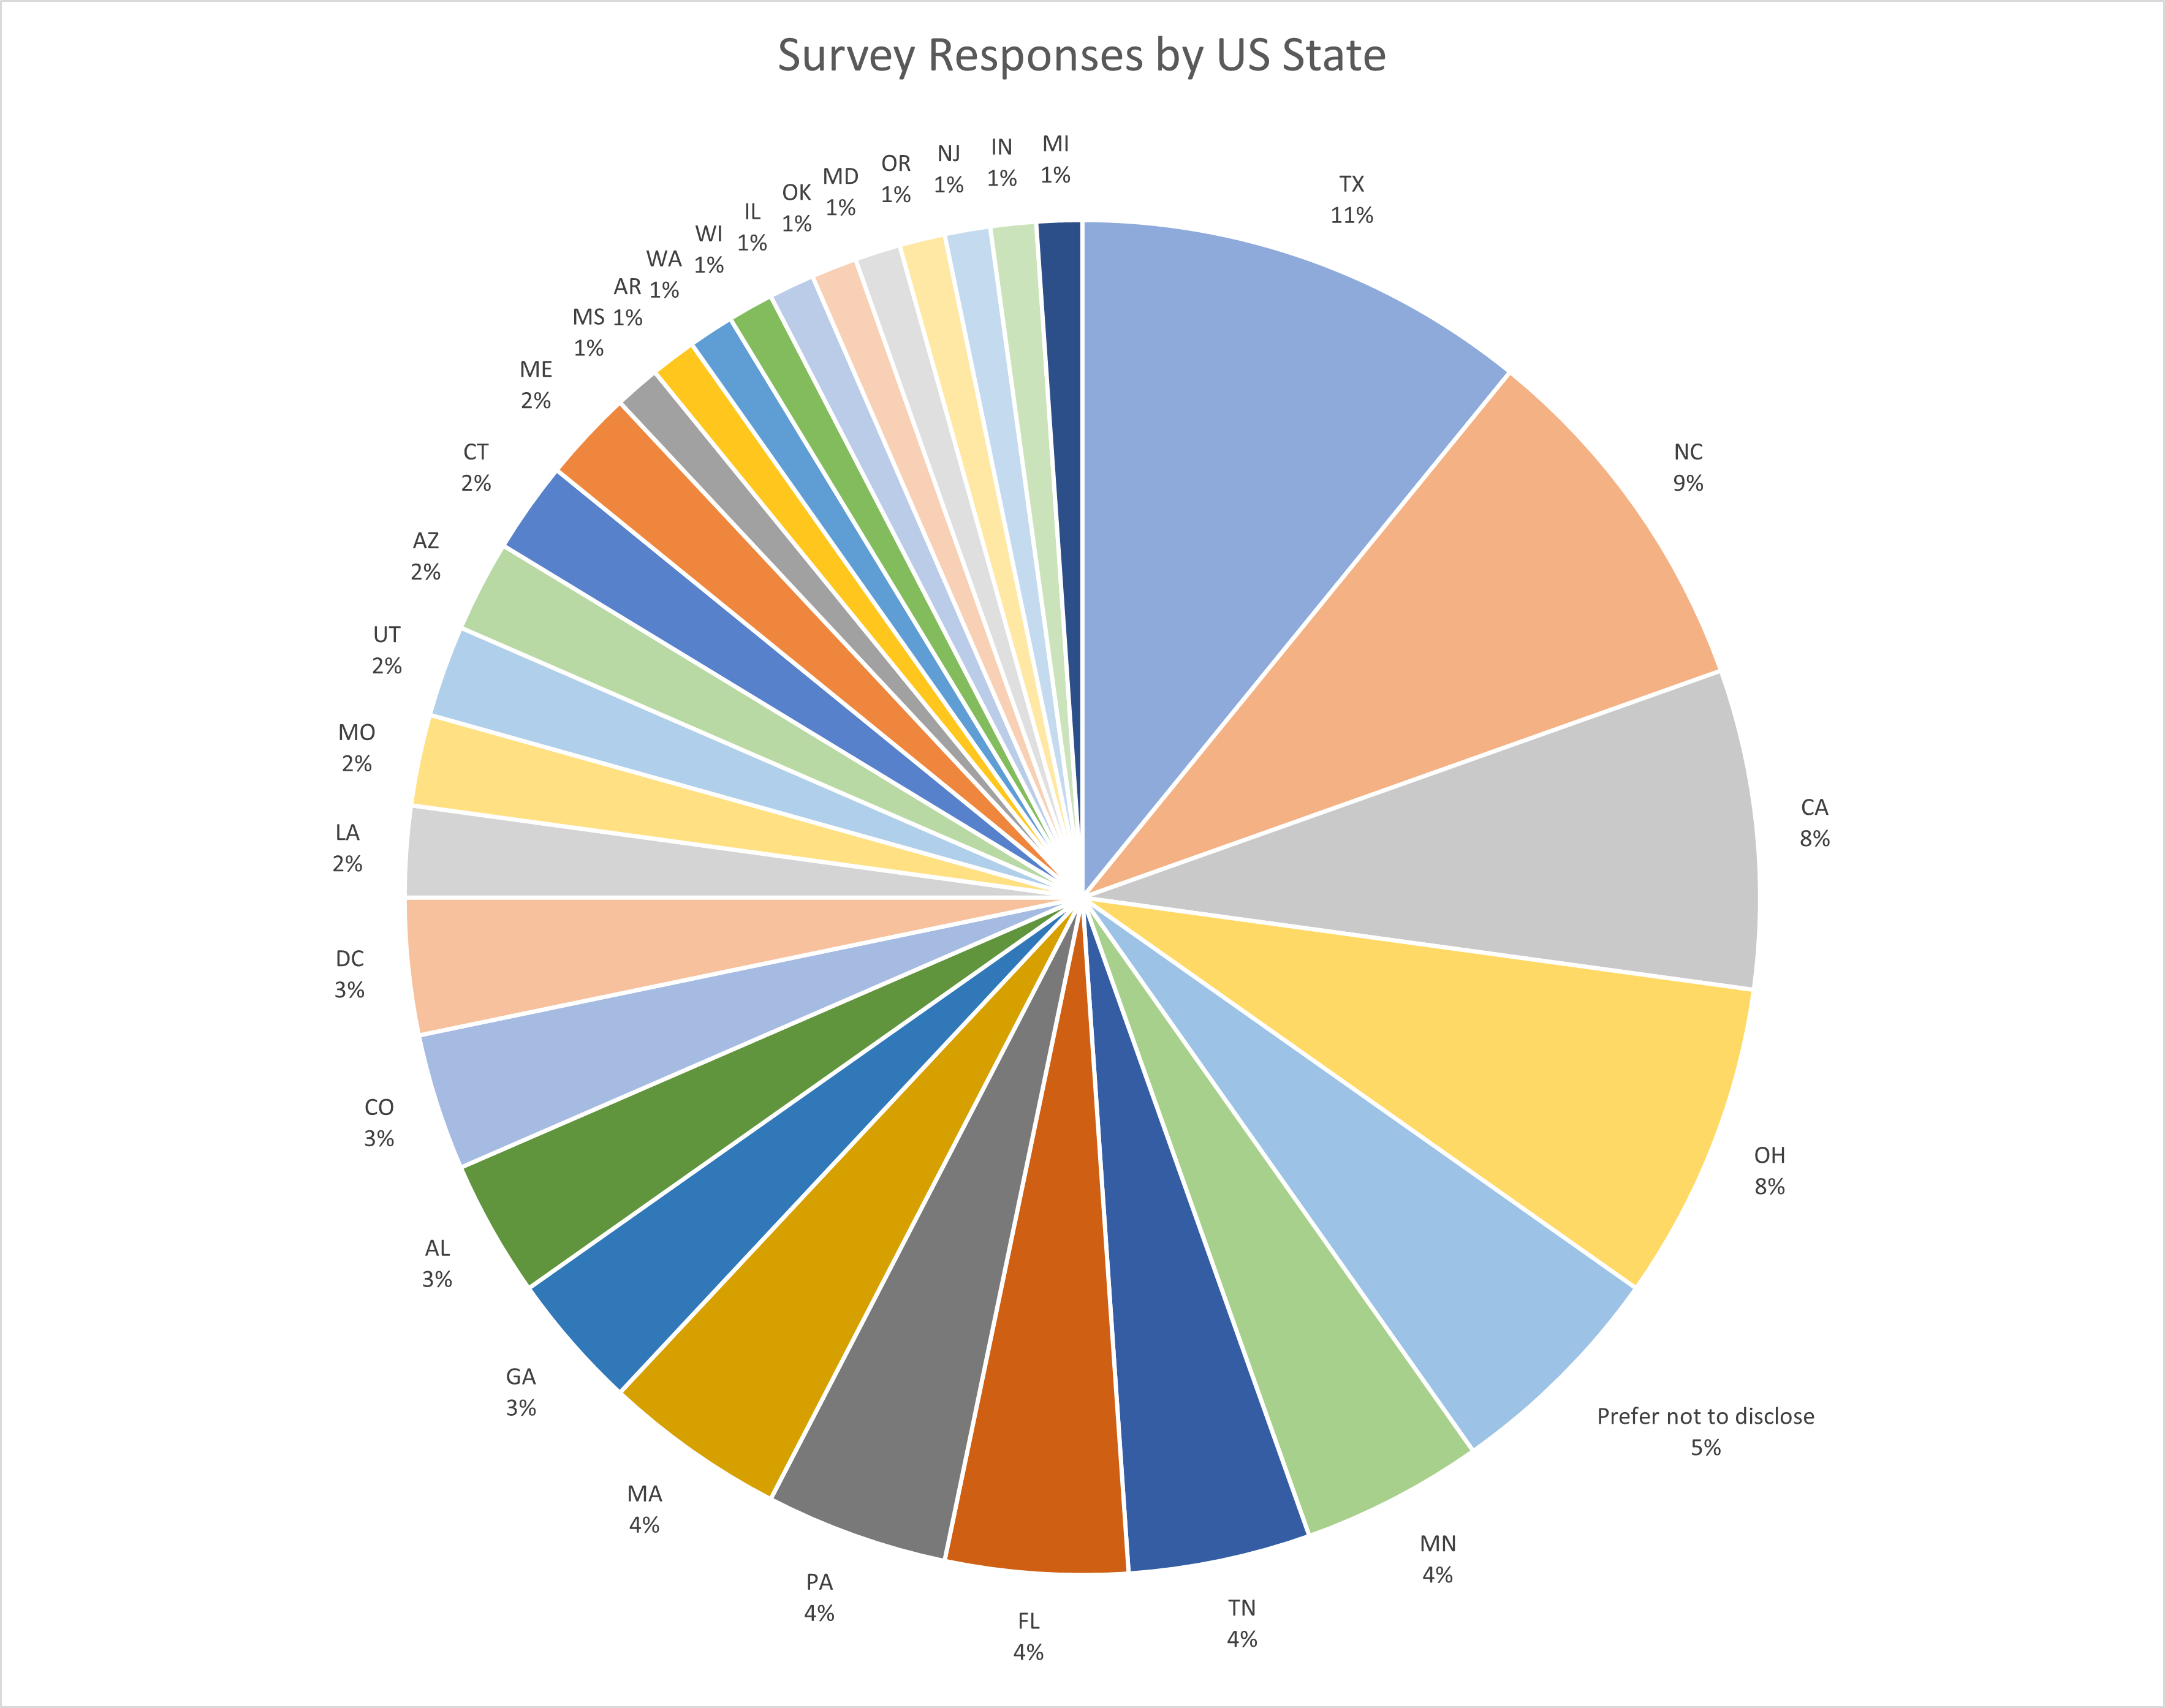
In what geographic location are you employed? [State]
This question pertains to US based responses only.
Survey Responses by State
Response
Percent of Respondents
TX
10.87%
NC
8.70%
CA
7.61%
OH
7.61%
Prefer not to disclose
5.43%
MN
4.35%
TN
4.35%
FL
4.35%
PA
4.35%
MA
4.35%
GA
3.26%
AL
3.26%
CO
3.26%
DC
3.26%
LA
2.17%
MO
2.17%
UT
2.17%
AZ
2.17%
CT
2.17%
ME
2.17%
MS
1.09%
AR
1.09%
WA
1.09%
WI
1.09%
IL
1.09%
OK
1.09%
MD
1.09%
OR
1.09%
NJ
1.09%
IN
1.09%
MI
1.09%
In what geographic location are you employed? [India Province]
This question pertains to India based responses only.
Survey Responses by Province (India)
Response
Percent of Respondents
Karnataka
28.89%
Maharashtra
23.33%
Uttar Pradesh
15.56%
Telangana
10.00%
Haryana
8.89%
Tamilnadu
5.56%
Delhi
3.33%
Prefer not to disclose
2.22%
Andhra Pradesh
1.11%
Punjab
1.11%
In what geographic location are you employed? [Country]
Survey Responses by Country
Response
Percent of Respondents
United States
40.00%
India
39.13%
Canada
4.35%
United Kingdom
3.48%
Australia
2.61%
Brazil
1.74%
Prefer not to disclose
0.87%
Germany
0.87%
Belgium
0.87%
Switzerland
0.87%
Bulgaria
0.87%
Sweden
0.87%
Poland
0.87%
Costa Rica
0.43%
Netherlands
0.43%
Ukraine
0.43%
Italy
0.43%
Spain
0.43%
Philippines
0.43%
In what geographic location are you employed? [Continent]
The results of this question were inferred from responses to In which geographic location are you employed [Country] .
Survey Responses by Continent
Response
Percent of Respondents
North America
44.35%
Asia
39.57%
Europe
11.30%
Australia
2.61%
South America
2.17%
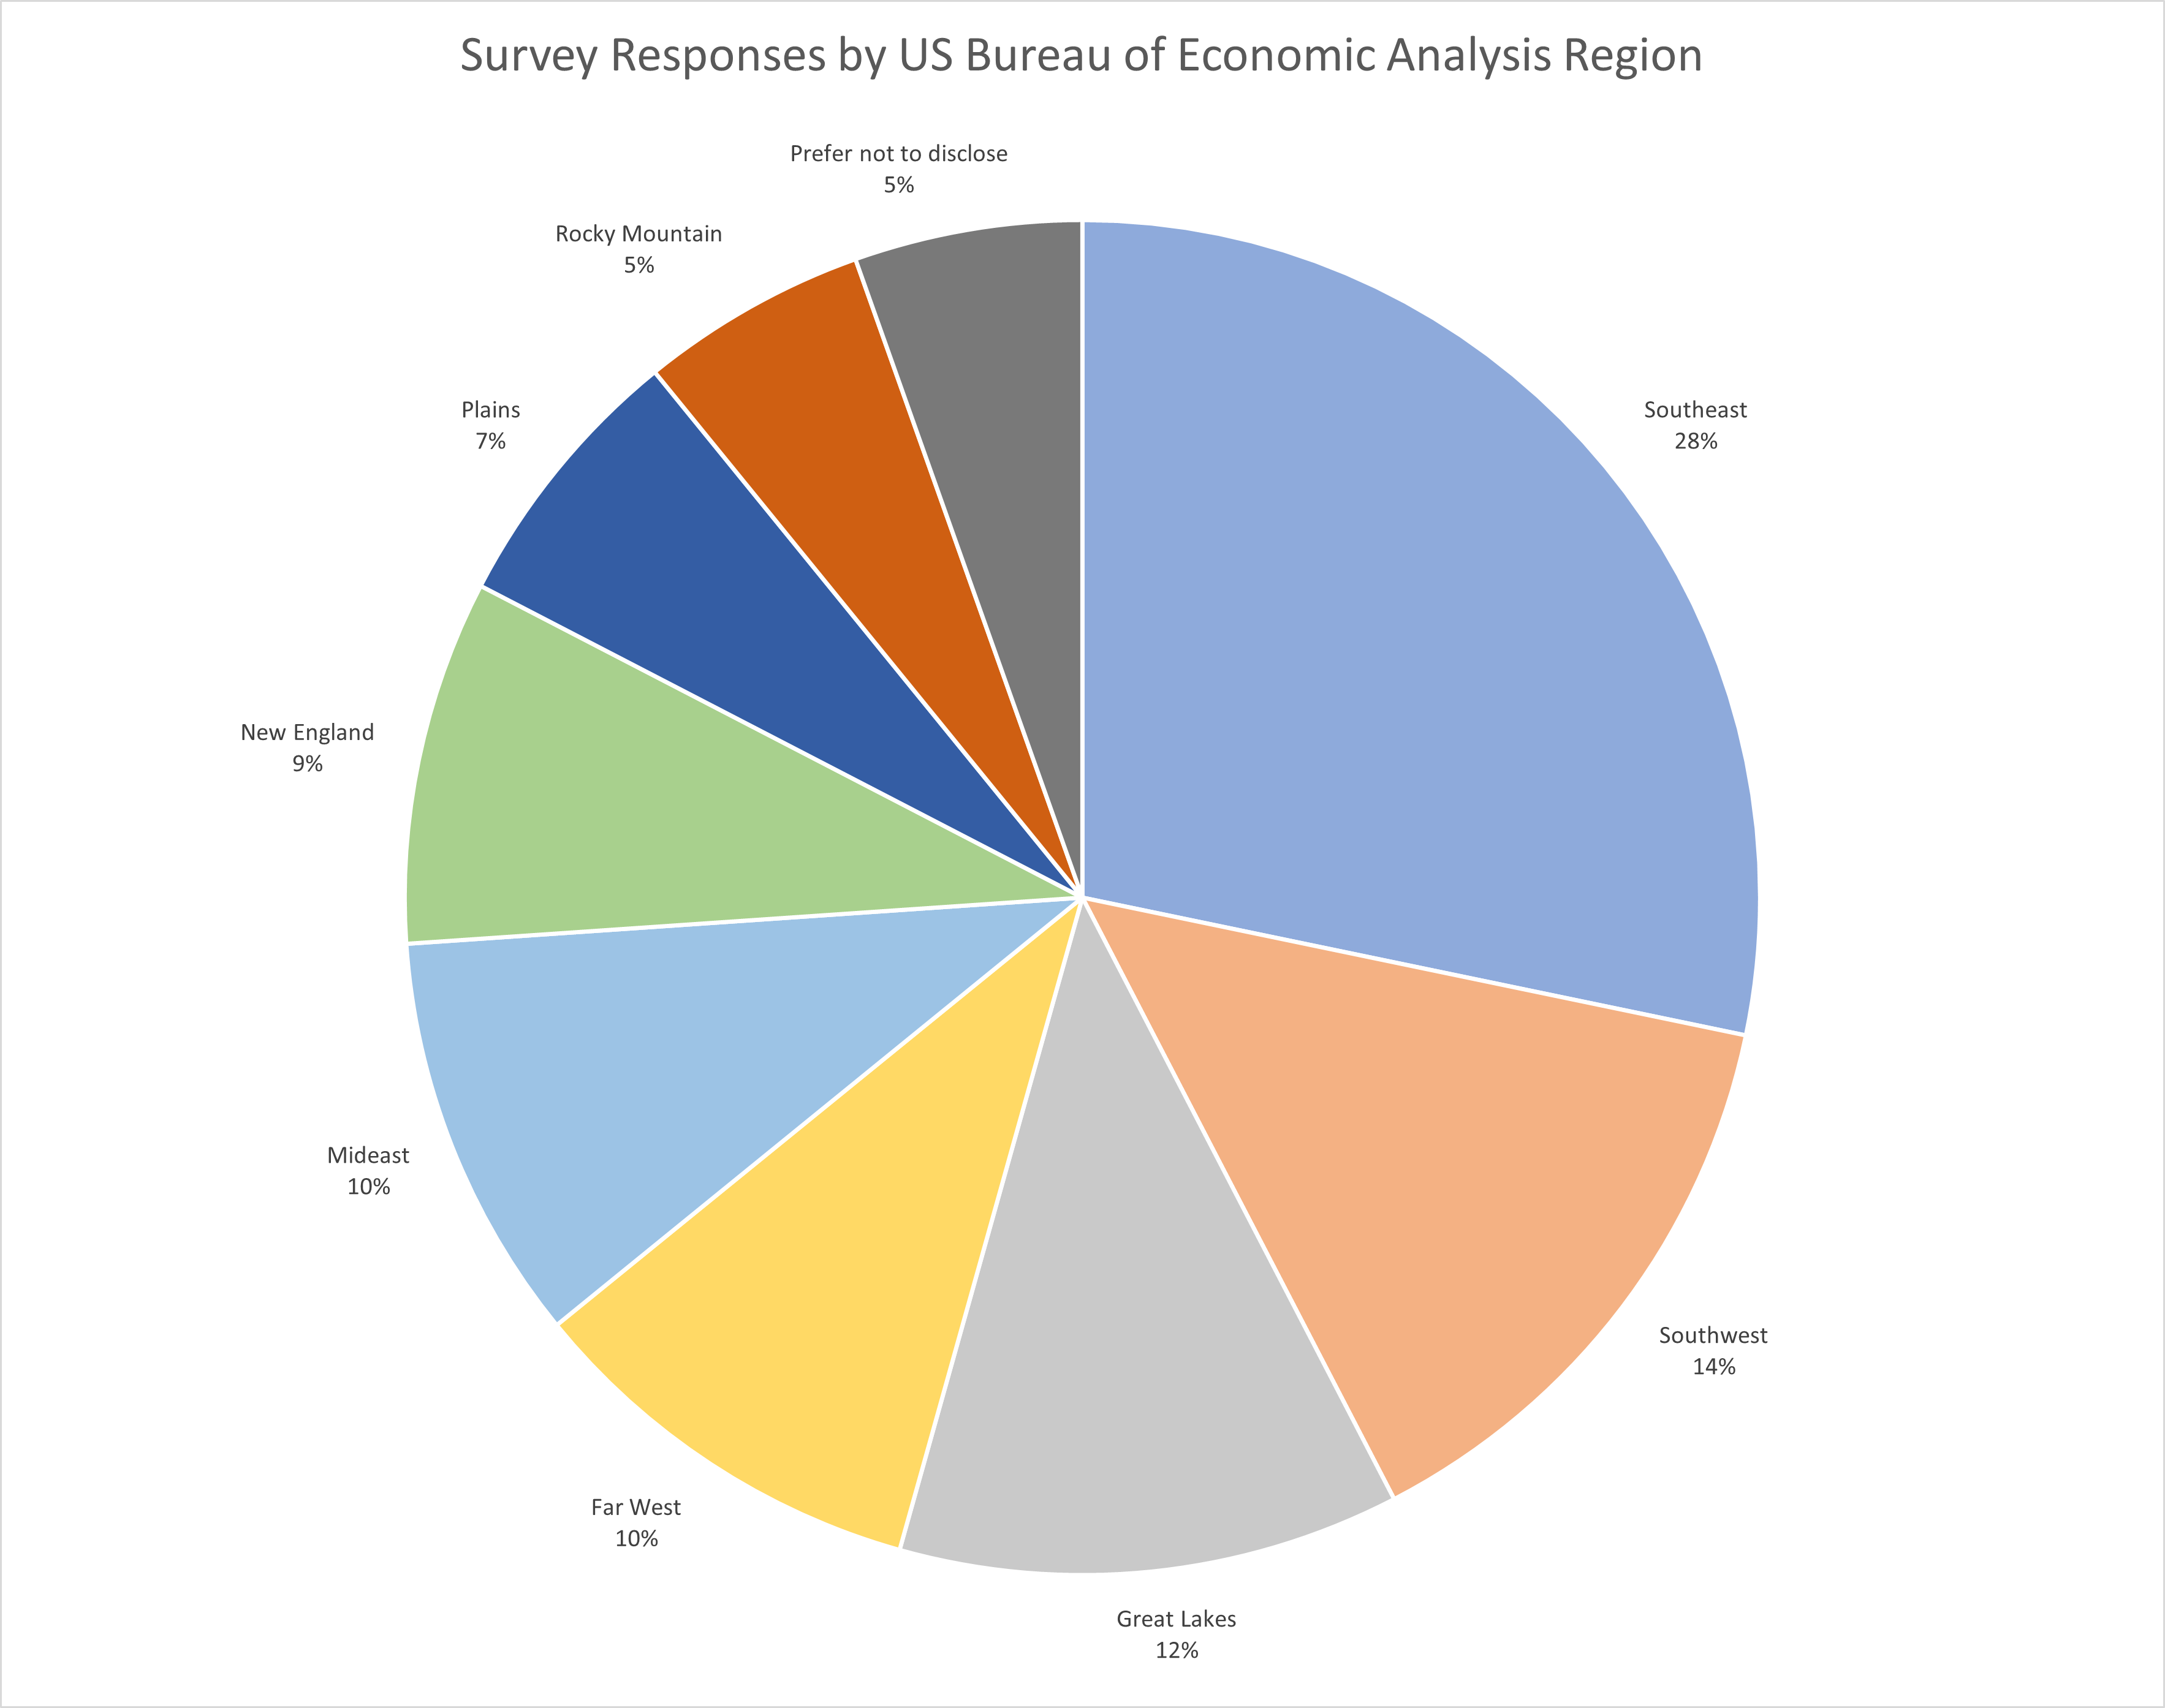
In what geographic location are you employed? [Bureau of Economic Analysis Region]
The results of this question were inferred from responses to In which geographic location are you employed [State] . This question pertains to US based responses only.
Survey Responses by Bureau of Economic Analysis Region
Response
Percent of Respondents
Southeast
28.26%
Southwest
14.13%
Great Lakes
11.96%
Far West
9.78%
Mideast
9.78%
New England
8.70%
Plains
6.52%
Rocky Mountain
5.43%
Prefer not to disclose
5.43%
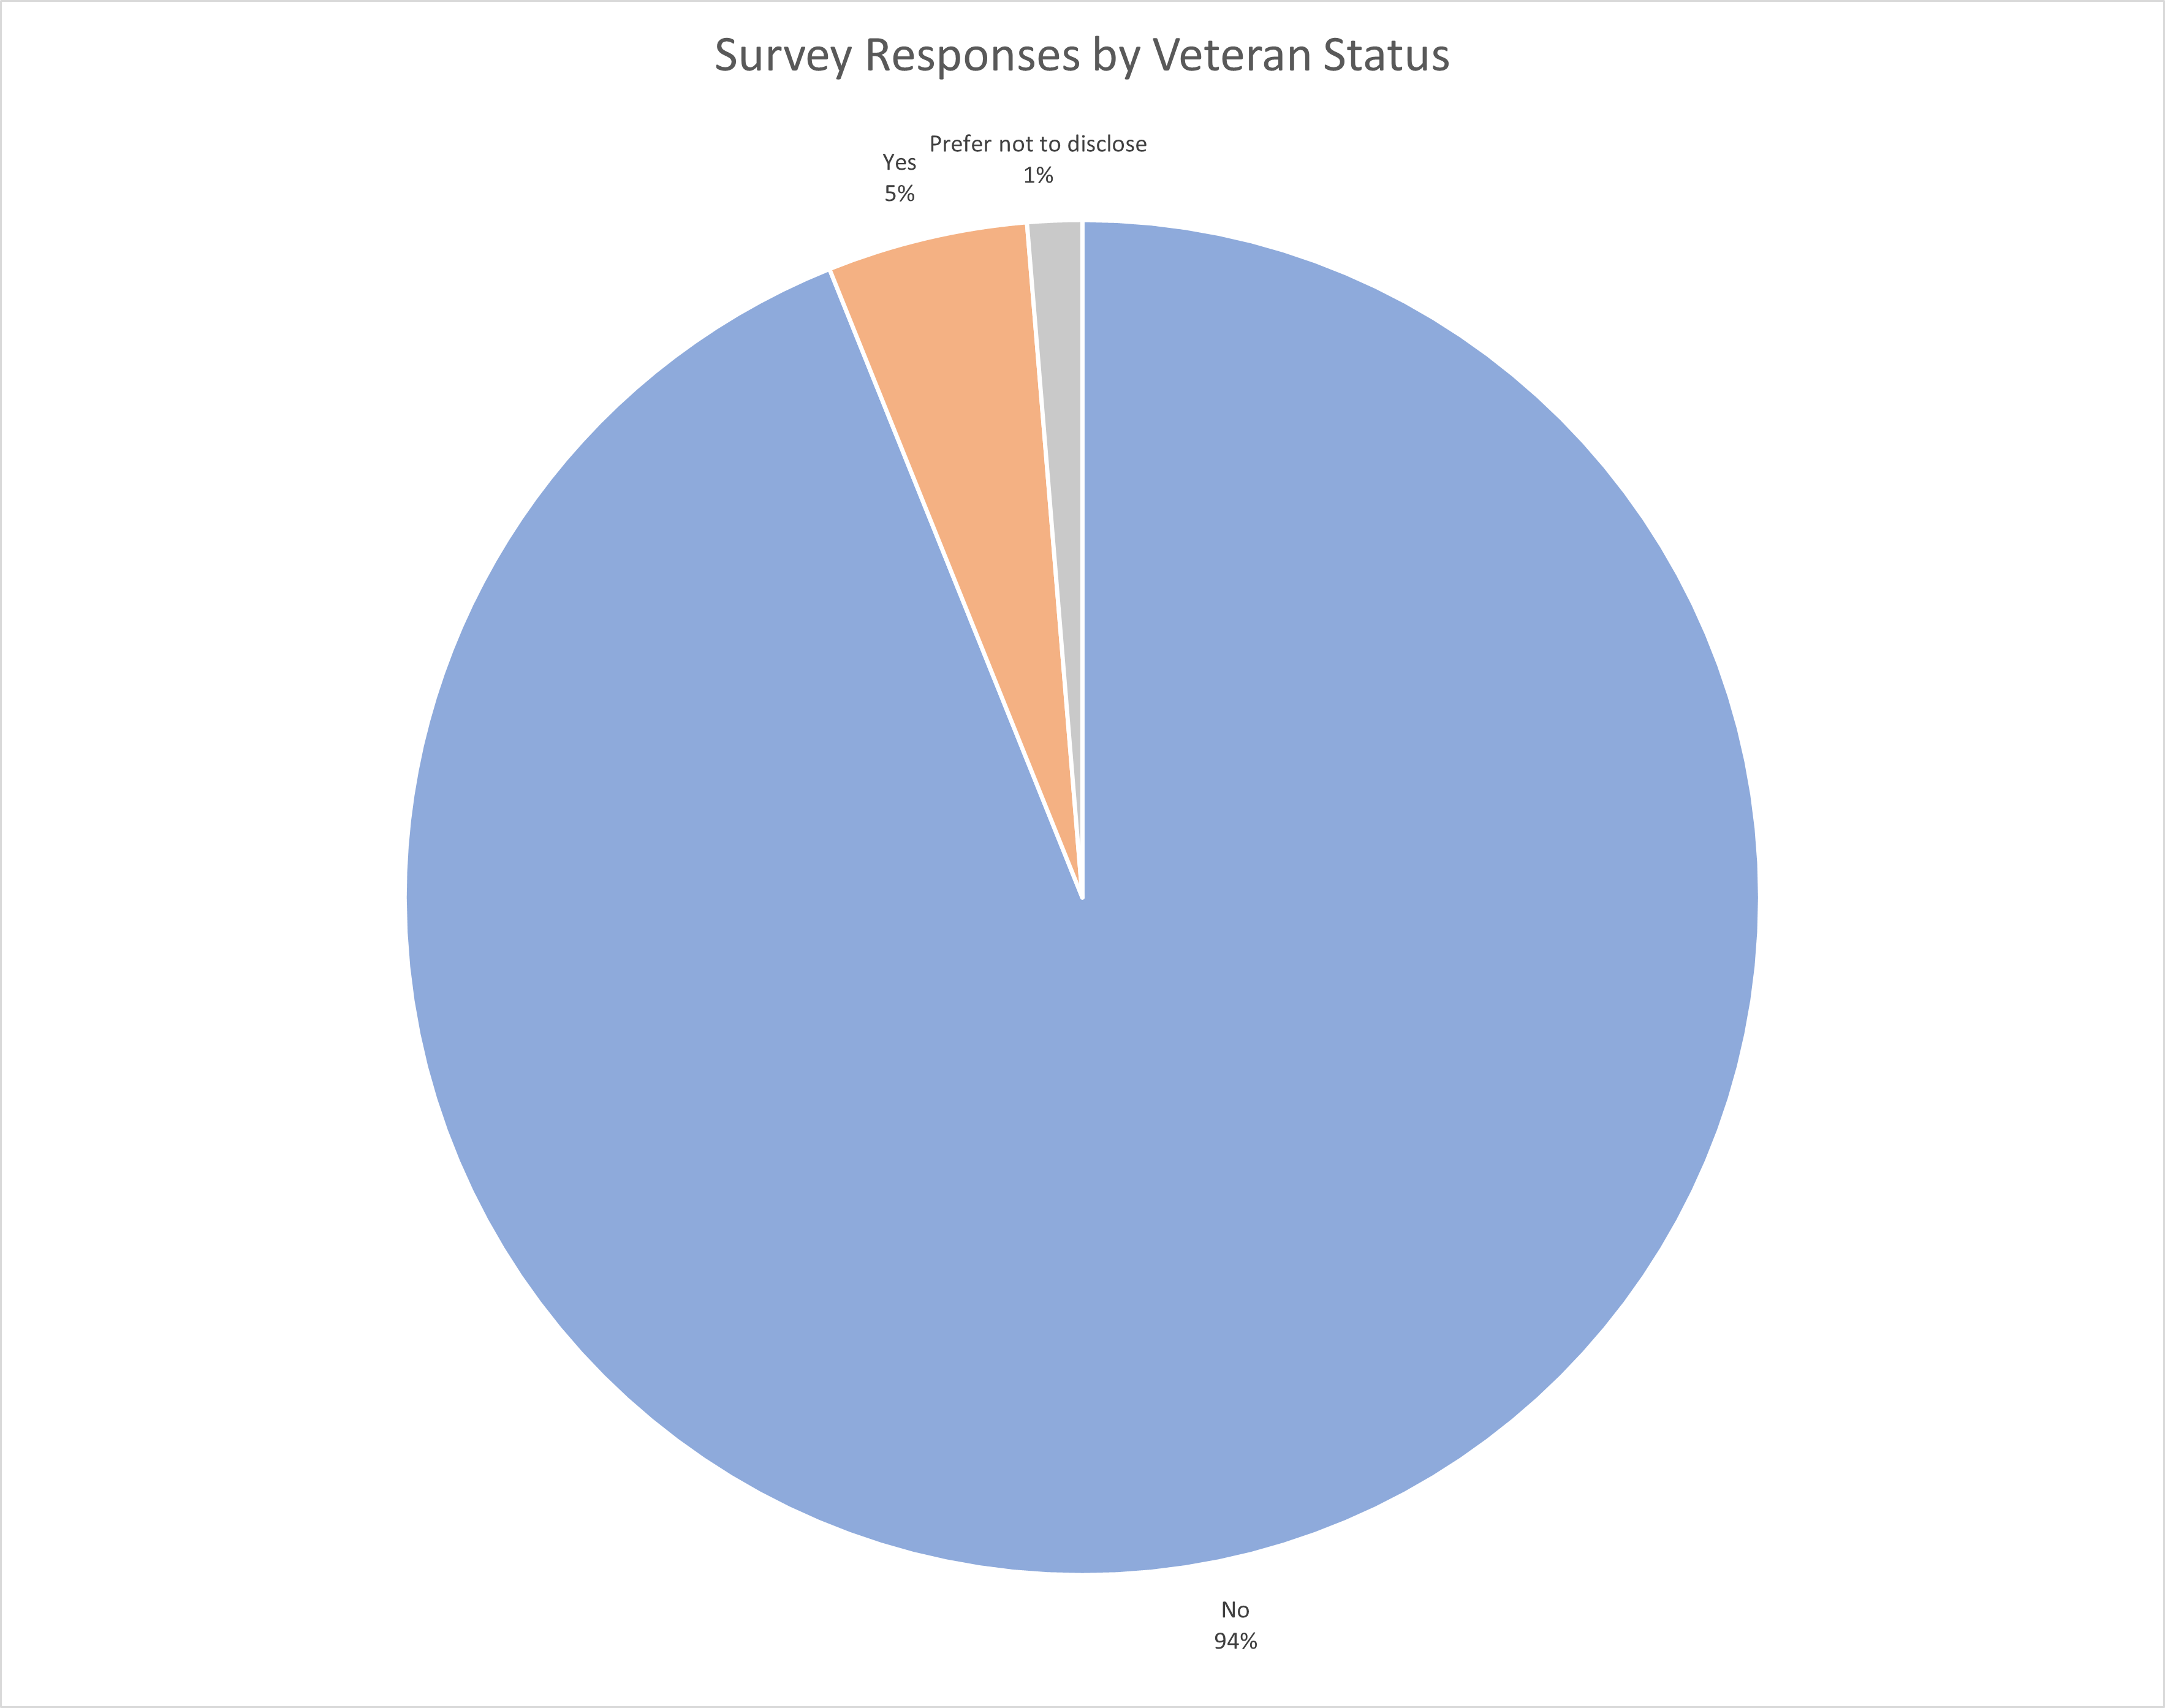
Are you a military veteran?
Survey Responses by Veteran Status
Response
Percent of Respondents
No
93.91%
Yes
4.78%
Prefer not to disclose
1.30%
Do you identify with the gender majority of the team(s) with whom you most closely work?
Survey Responses by Identifying with Team's Gender Majority
Response
Percent of Respondents
Yes
59.13%
No
26.96%
Not Sure
10.00%
Prefer not to disclose
3.91%
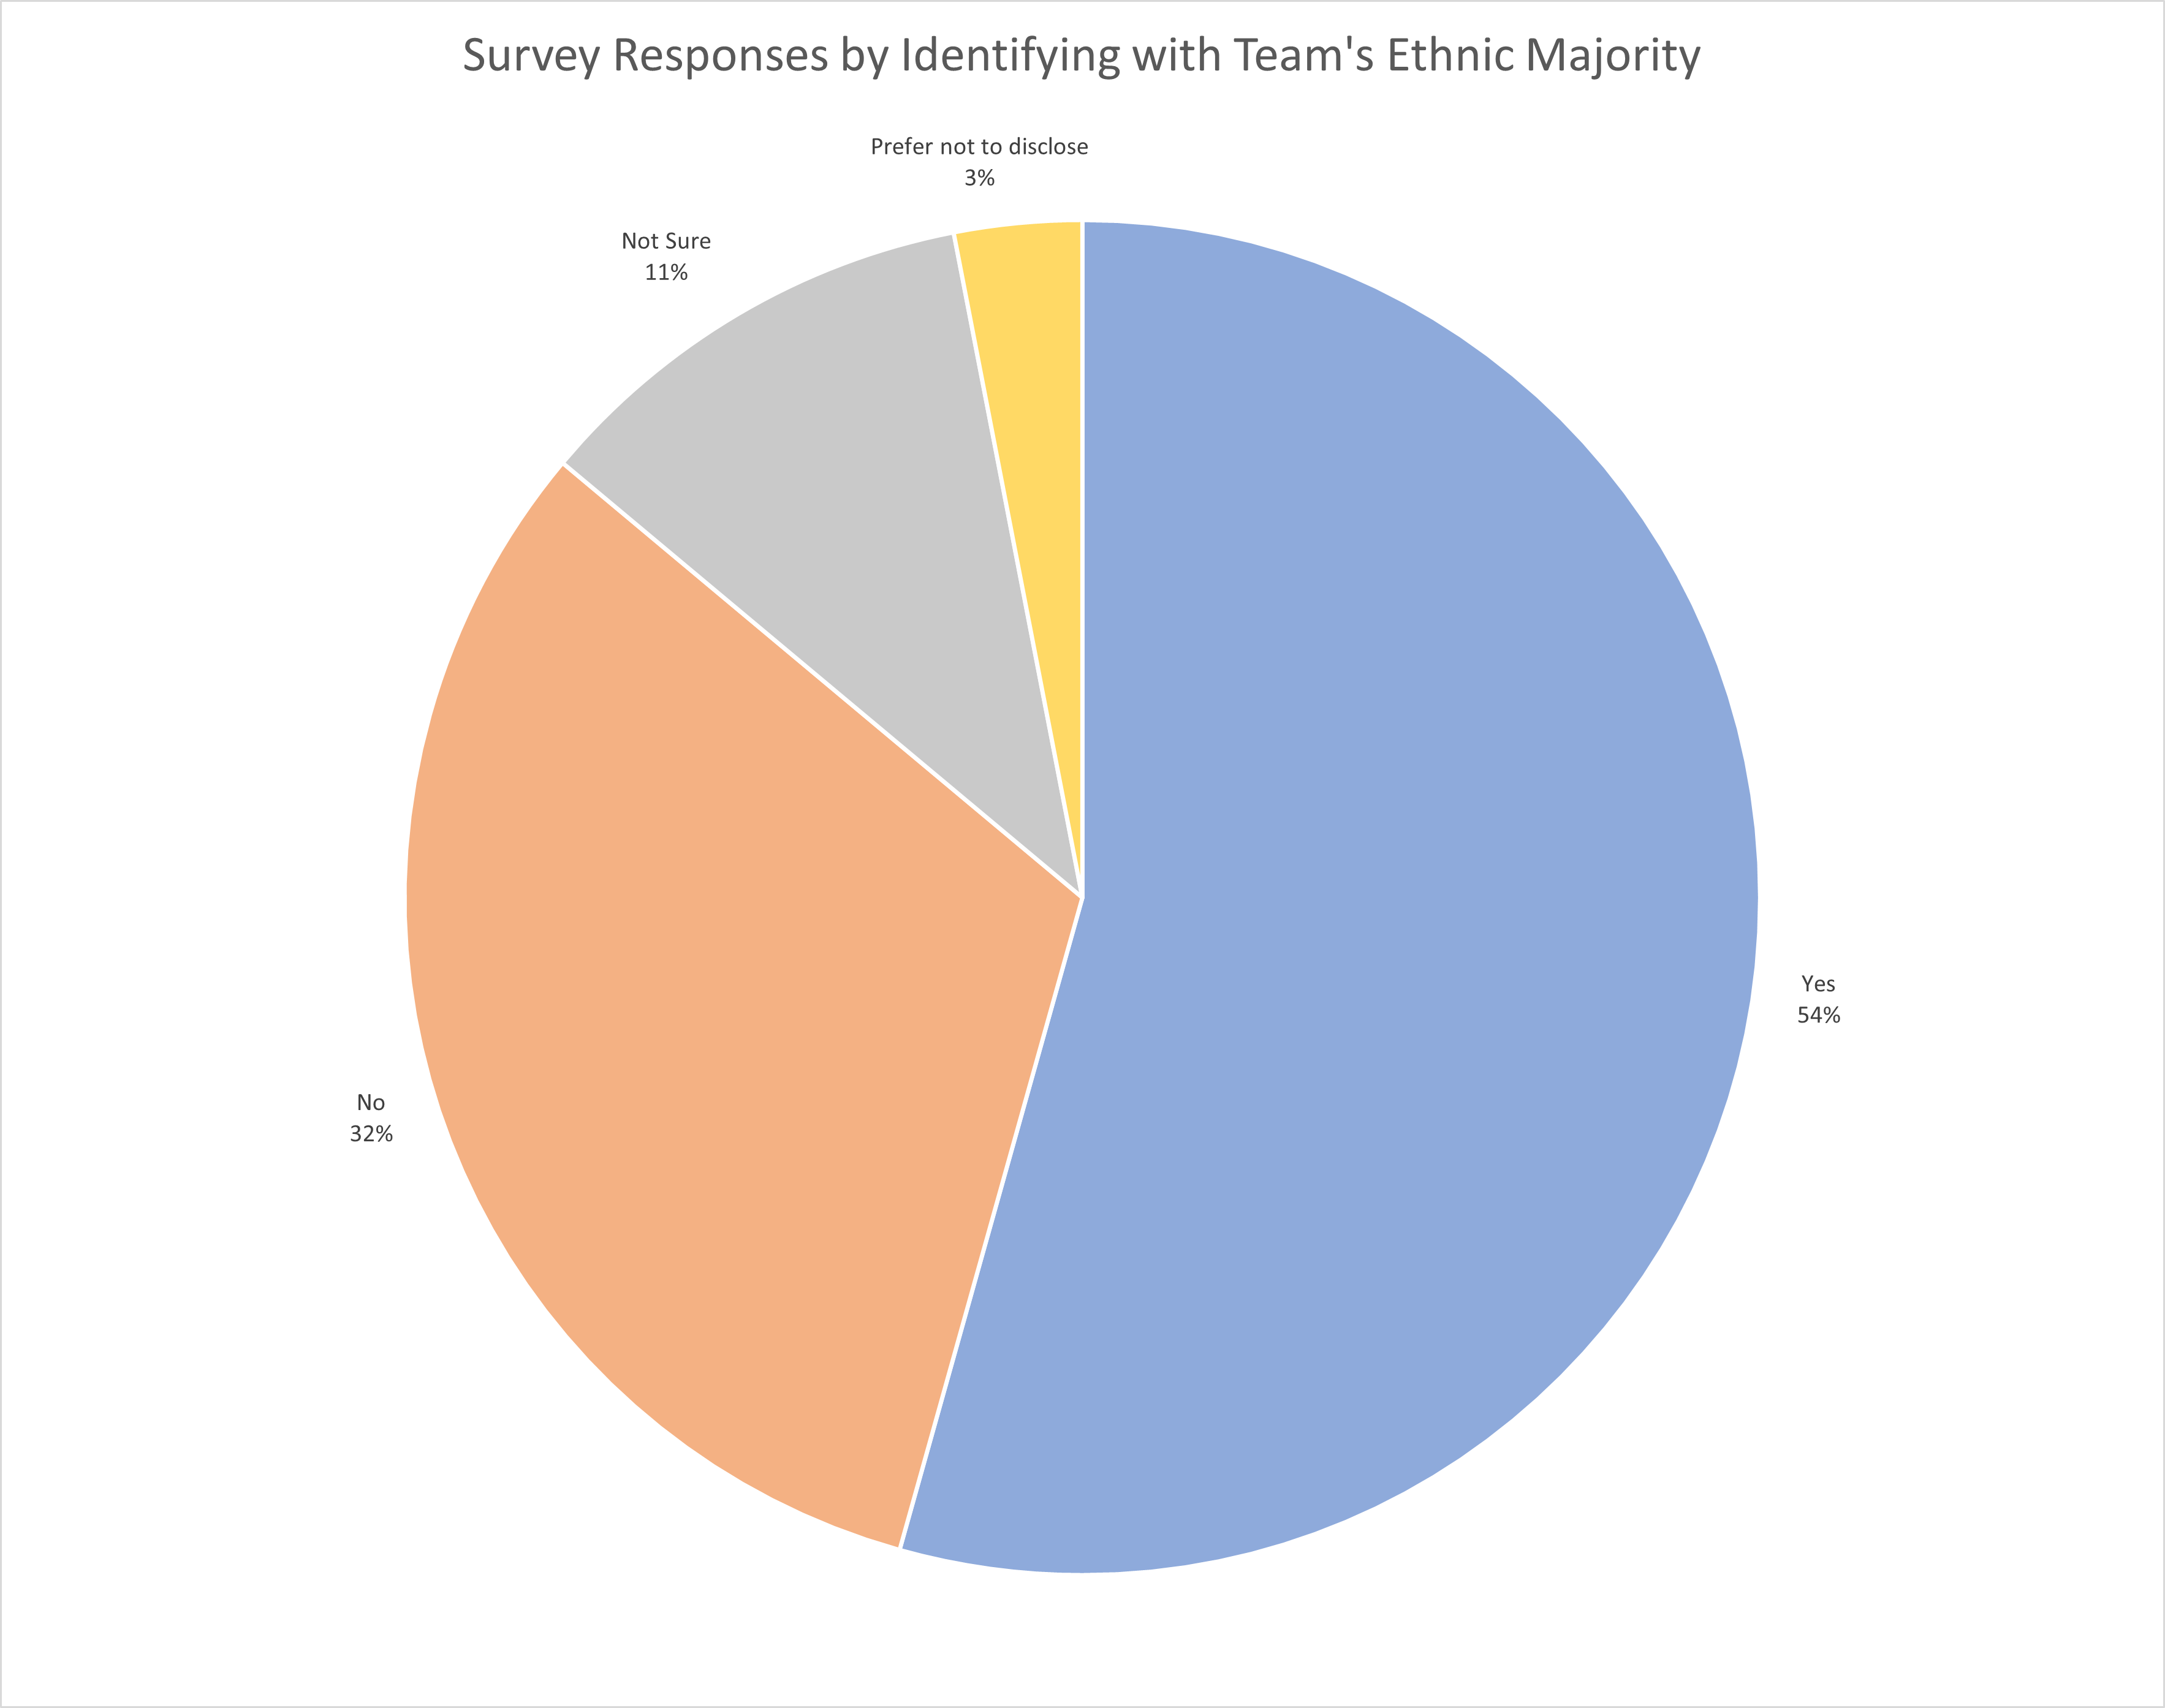
Do you identify with the ethnic majority of the team(s) with whom you most closely work?
Survey Responses by Identifying with Team's Ethnic Majority
Response
Percent of Respondents
Yes
54.35%
No
31.74%
Not Sure
10.87%
Prefer not to disclose
3.04%
Do you identify with the cultural majority of the team(s) with whom you most closely work?
Survey Responses by Identifying with Team's Cultural Majority
Response
Percent of Respondents
Yes
53.04%
No
26.52%
Not Sure
15.65%
Prefer not to disclose
4.78%
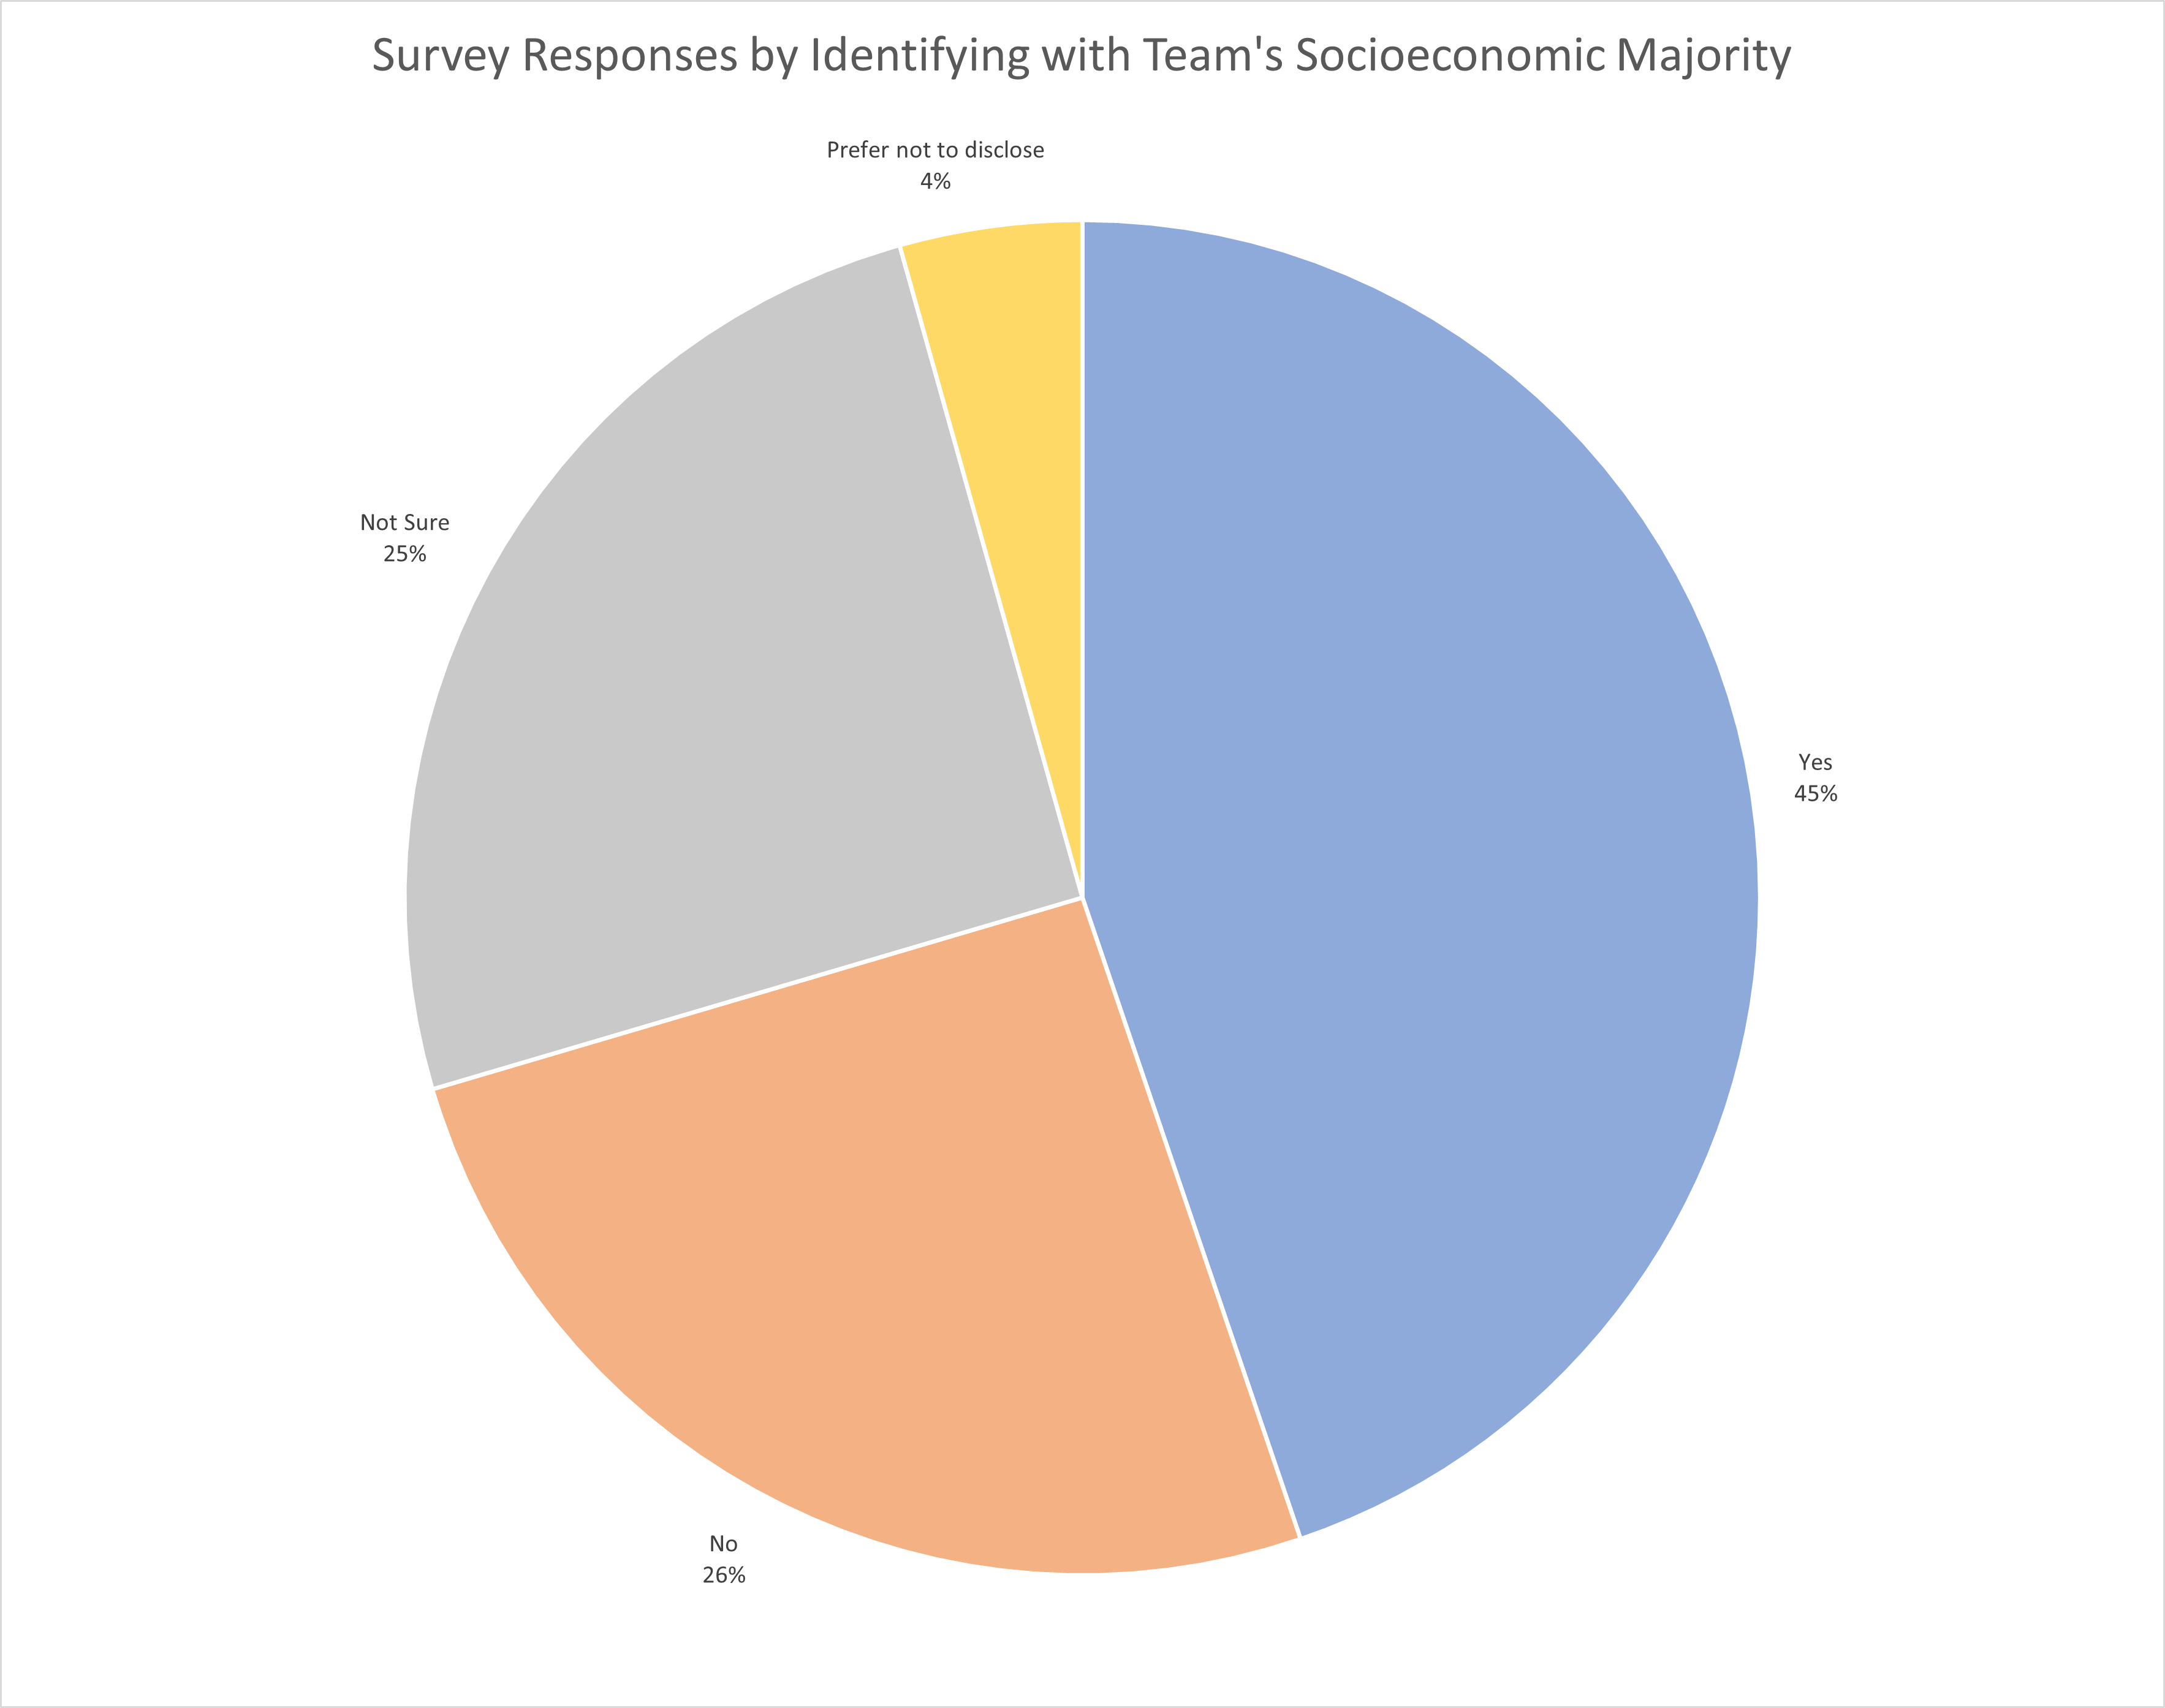
Do you identify with the socioeconomic majority of the team(s) with whom you most closely work?
Survey Responses by Identifying with Team's Socioeconomic Majority
Response
Percent of Respondents
Yes
44.78%
No
25.65%
Not Sure
25.22%
Prefer not to disclose
4.35%
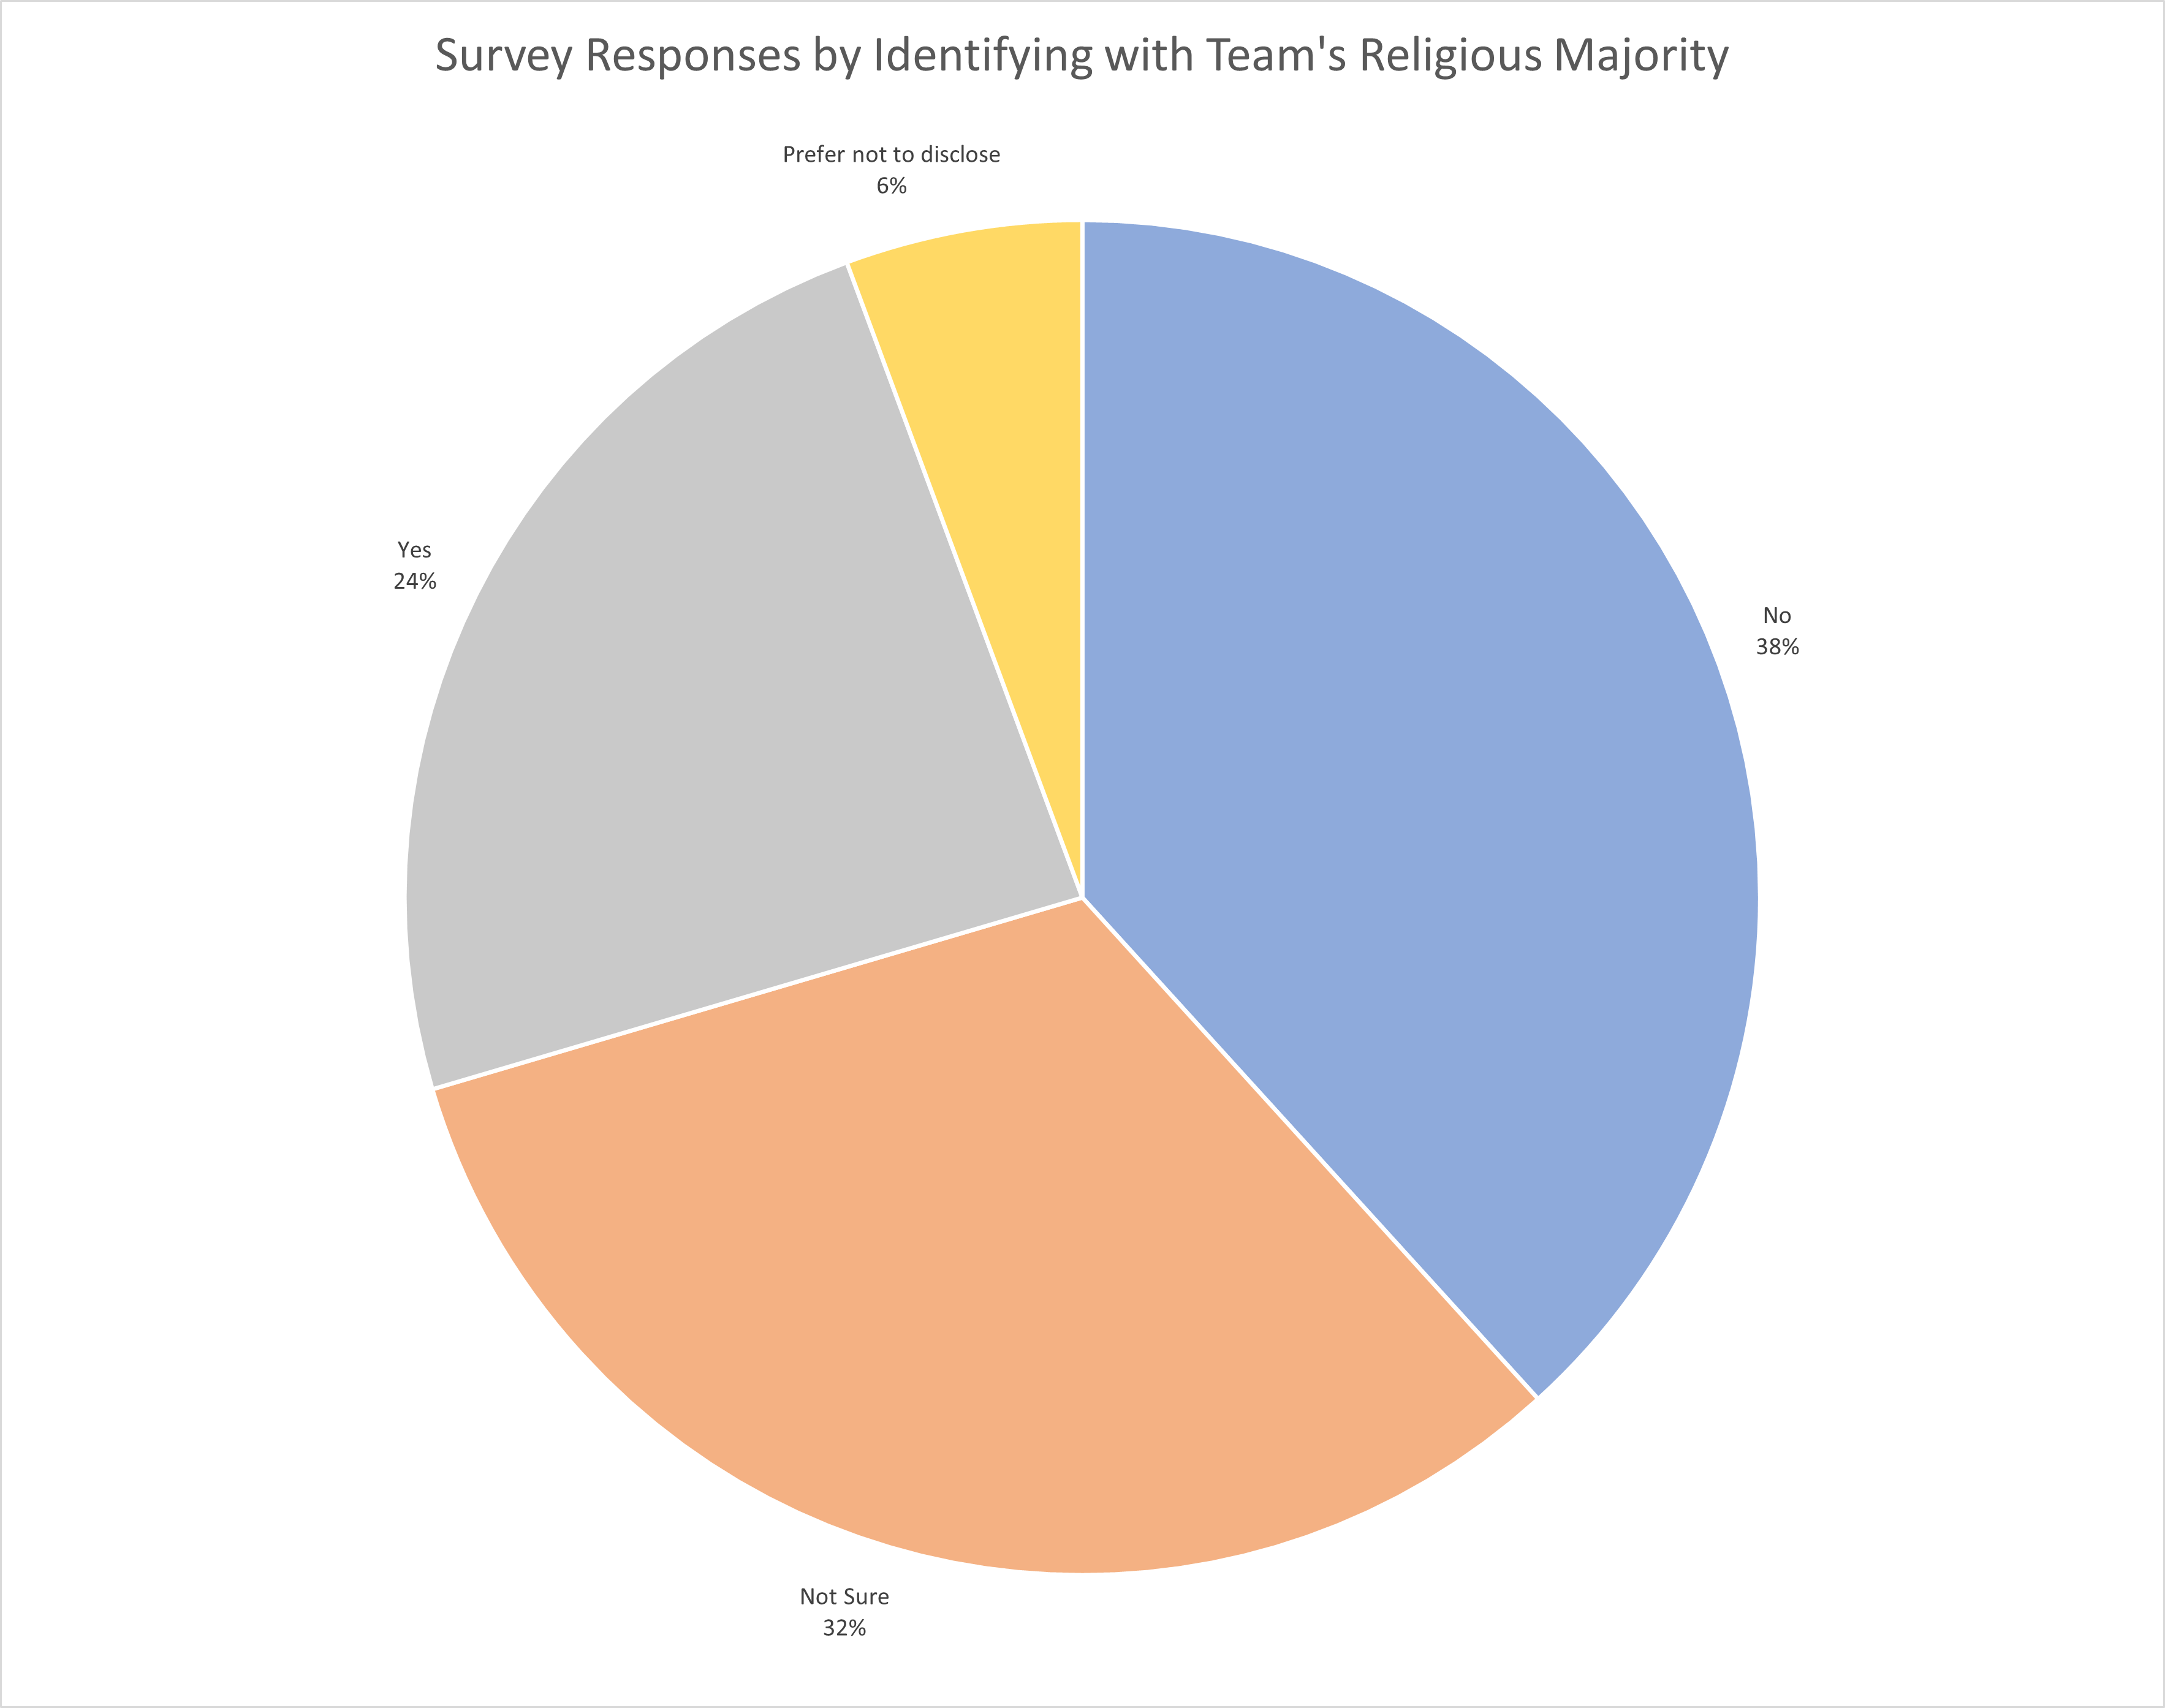
Do you identify with the religious majority of the team(s) with whom you most closely work?
Survey Responses by Identifying with Team's Religious Majority
Response
Percent of Respondents
No
38.26%
Not Sure
32.17%
Yes
23.91%
Prefer not to disclose
5.65%
Is your first language the preferred language of the team(s) with whom you most closely work?
Survey Responses by Respondent's First Language matching the Preferred Language of the Team
Response
Percent of Respondents
Yes
63.04%
No
32.17%
Not Sure
2.61%
Prefer not to disclose
2.17%
What is the highest level of education that you completed?
Survey Responses by Highest Level of Education
Response
Percent of Respondents
1 - High School Diploma, GCSEs or equivalent
3.48%
2 - Some College
7.83%
3 - Trade or Vocational Degree or Certificate or equivalent
0.87%
4 - Associates Degree or Certificate or equivalent
4.35%
5 - Bachelor’s Degree or equivalent
56.52%
6 - Master’s Degree or equivalent
25.65%
Prefer not to disclose
1.30%
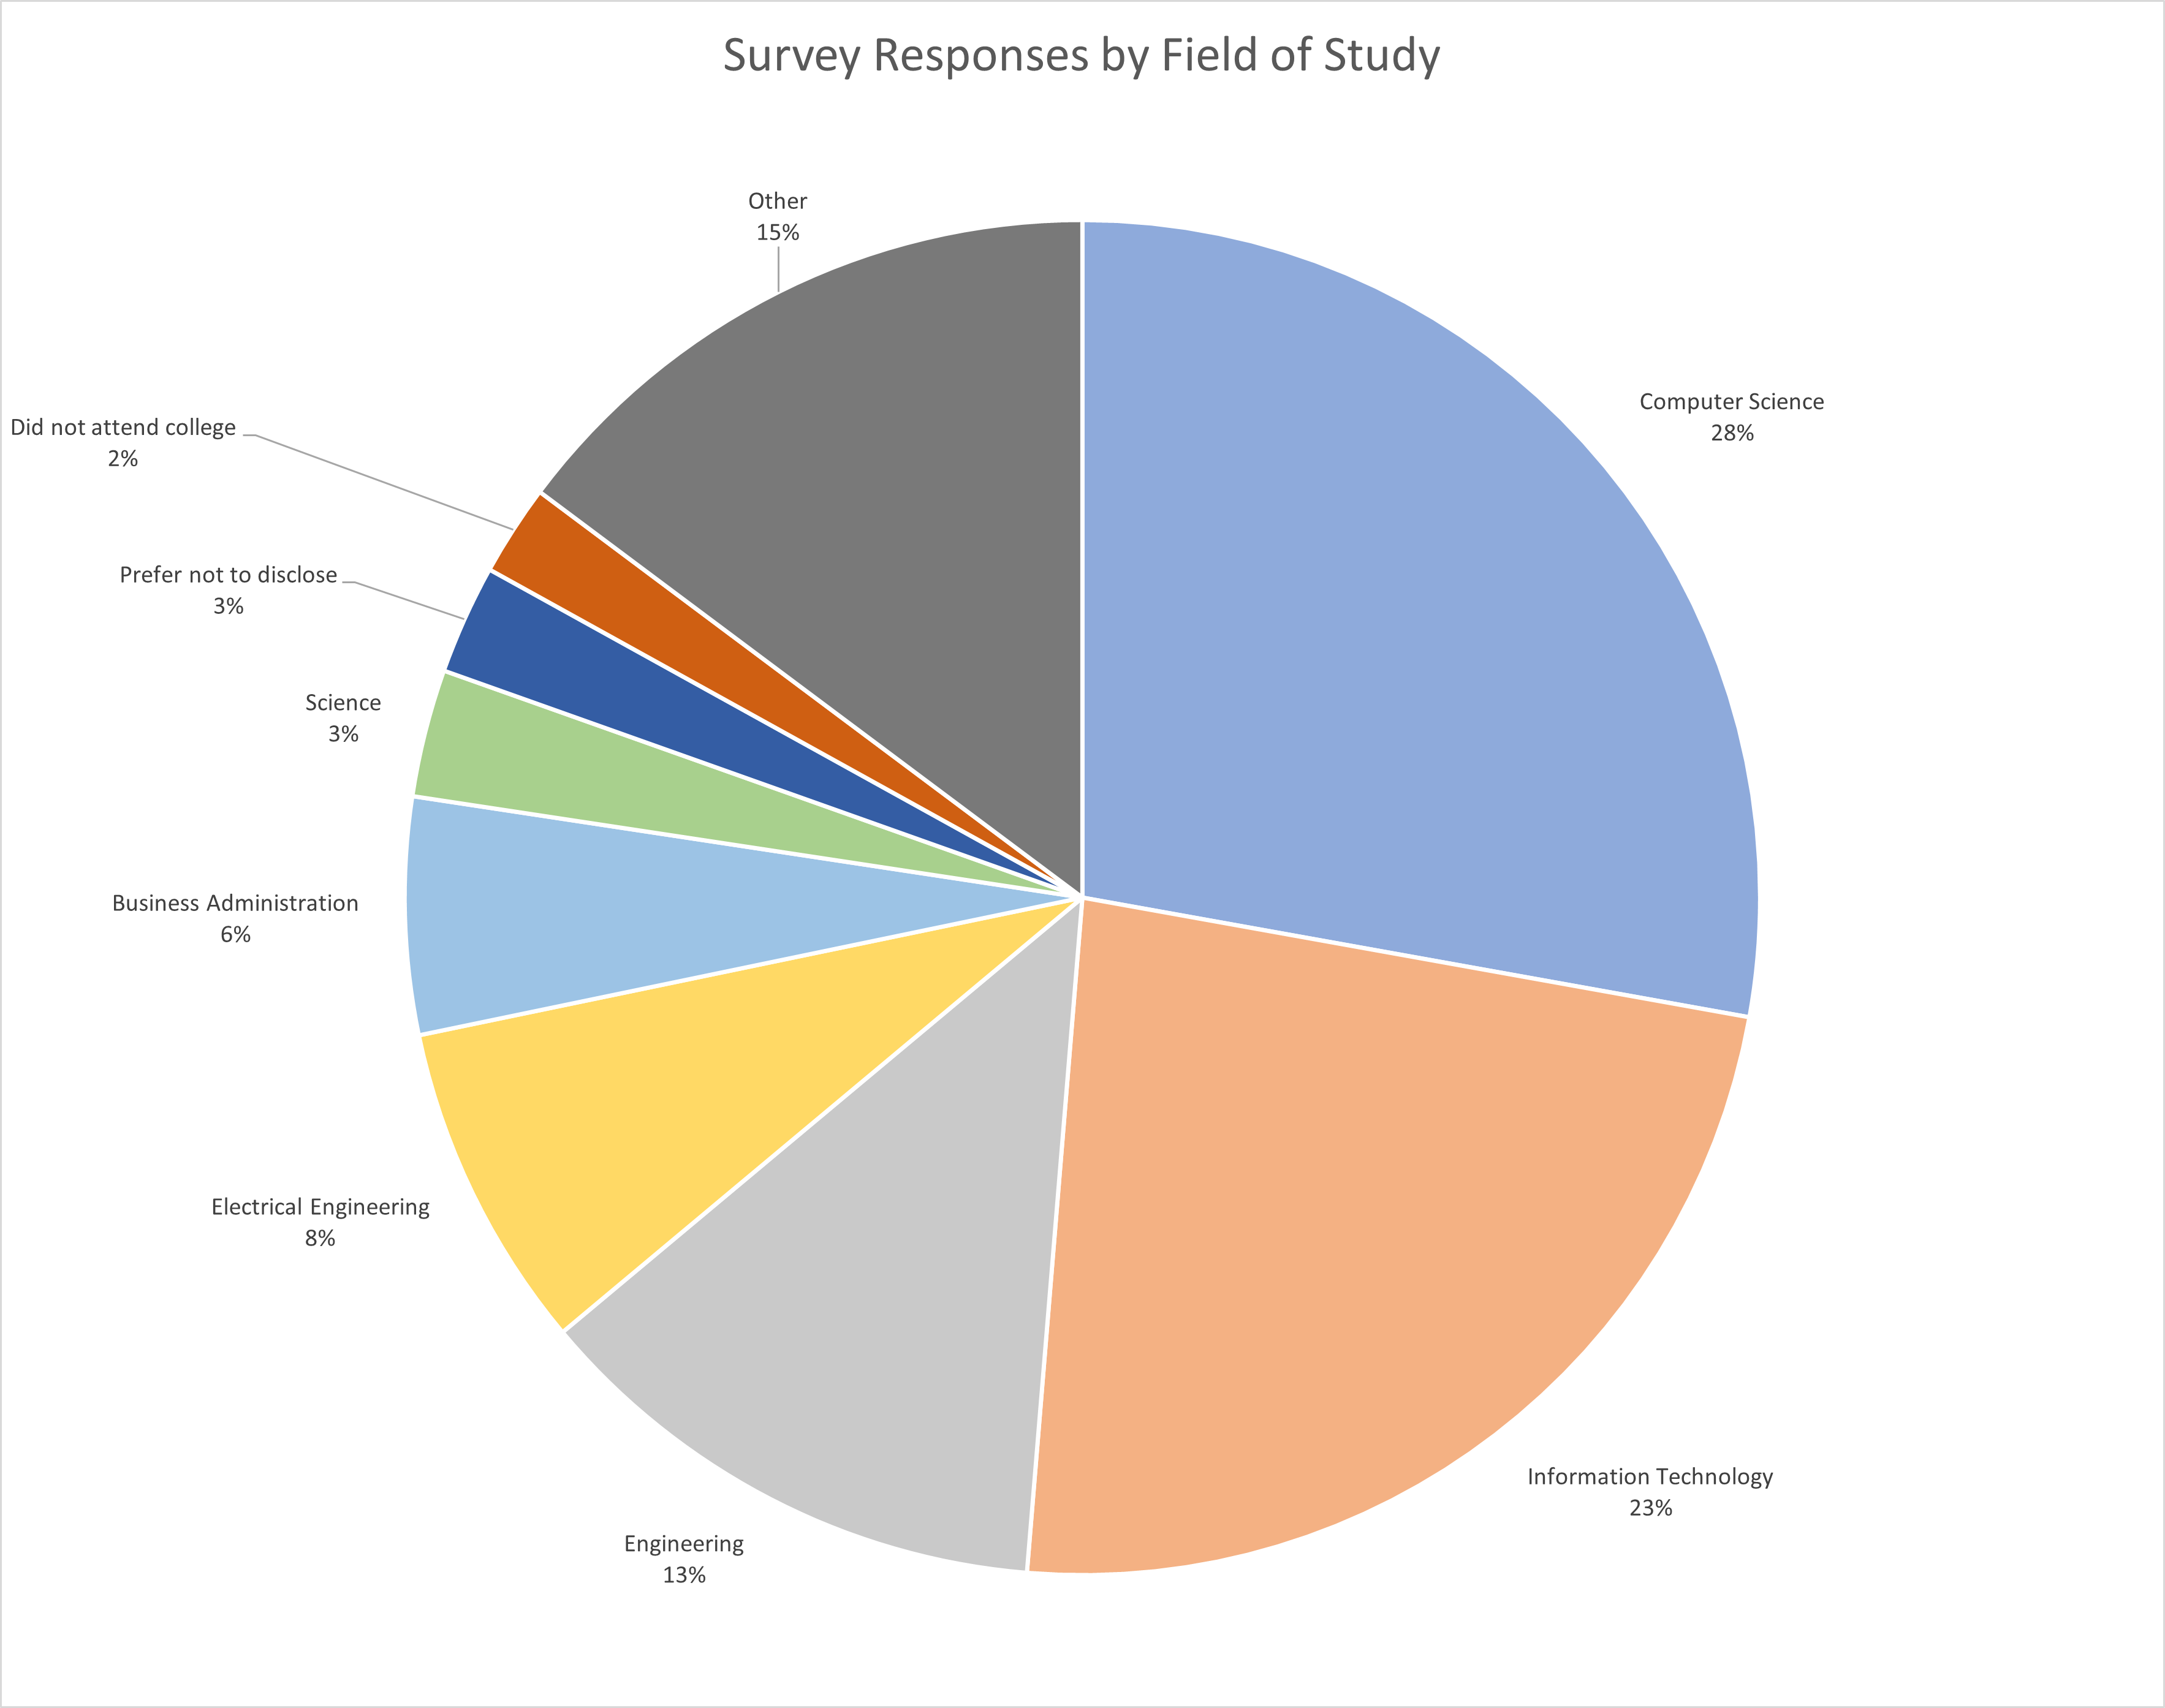
If you attended college, what was your field of study?
Survey Responses by Highest Level of Education
Response
Percent of Respondents
Computer Science
27.83%
Information Technology
23.48%
Engineering
12.61%
Electrical Engineering
7.83%
Business Administration
5.65%
Science
3.04%
Prefer not to disclose
2.61%
Did not attend college
2.17%
Economics
1.30%
Software Engineering
1.30%
Electronics and Communication
0.87%
Mechanical Engineering
0.87%
Political Science
0.87%
Religious Studies
0.43%
Music
0.43%
Anthropology
0.43%
Fine Arts
0.43%
Nursing
0.43%
History
0.43%
Electronics and Communication Engineering
0.43%
Industrial / Systems Engineering
0.43%
Multimedia and Web Design
0.43%
Sociology/Anthropology
0.43%
Non-science major
0.43%
Philosophy
0.43%
English Literature
0.43%
Communications
0.43%
Arts
0.43%
Psychology
0.43%
Interdisciplinary
0.43%
Electronics
0.43%
Liberal Arts
0.43%
Mathematics
0.43%
Accounting
0.43%
Interactive Entertainment
0.43%
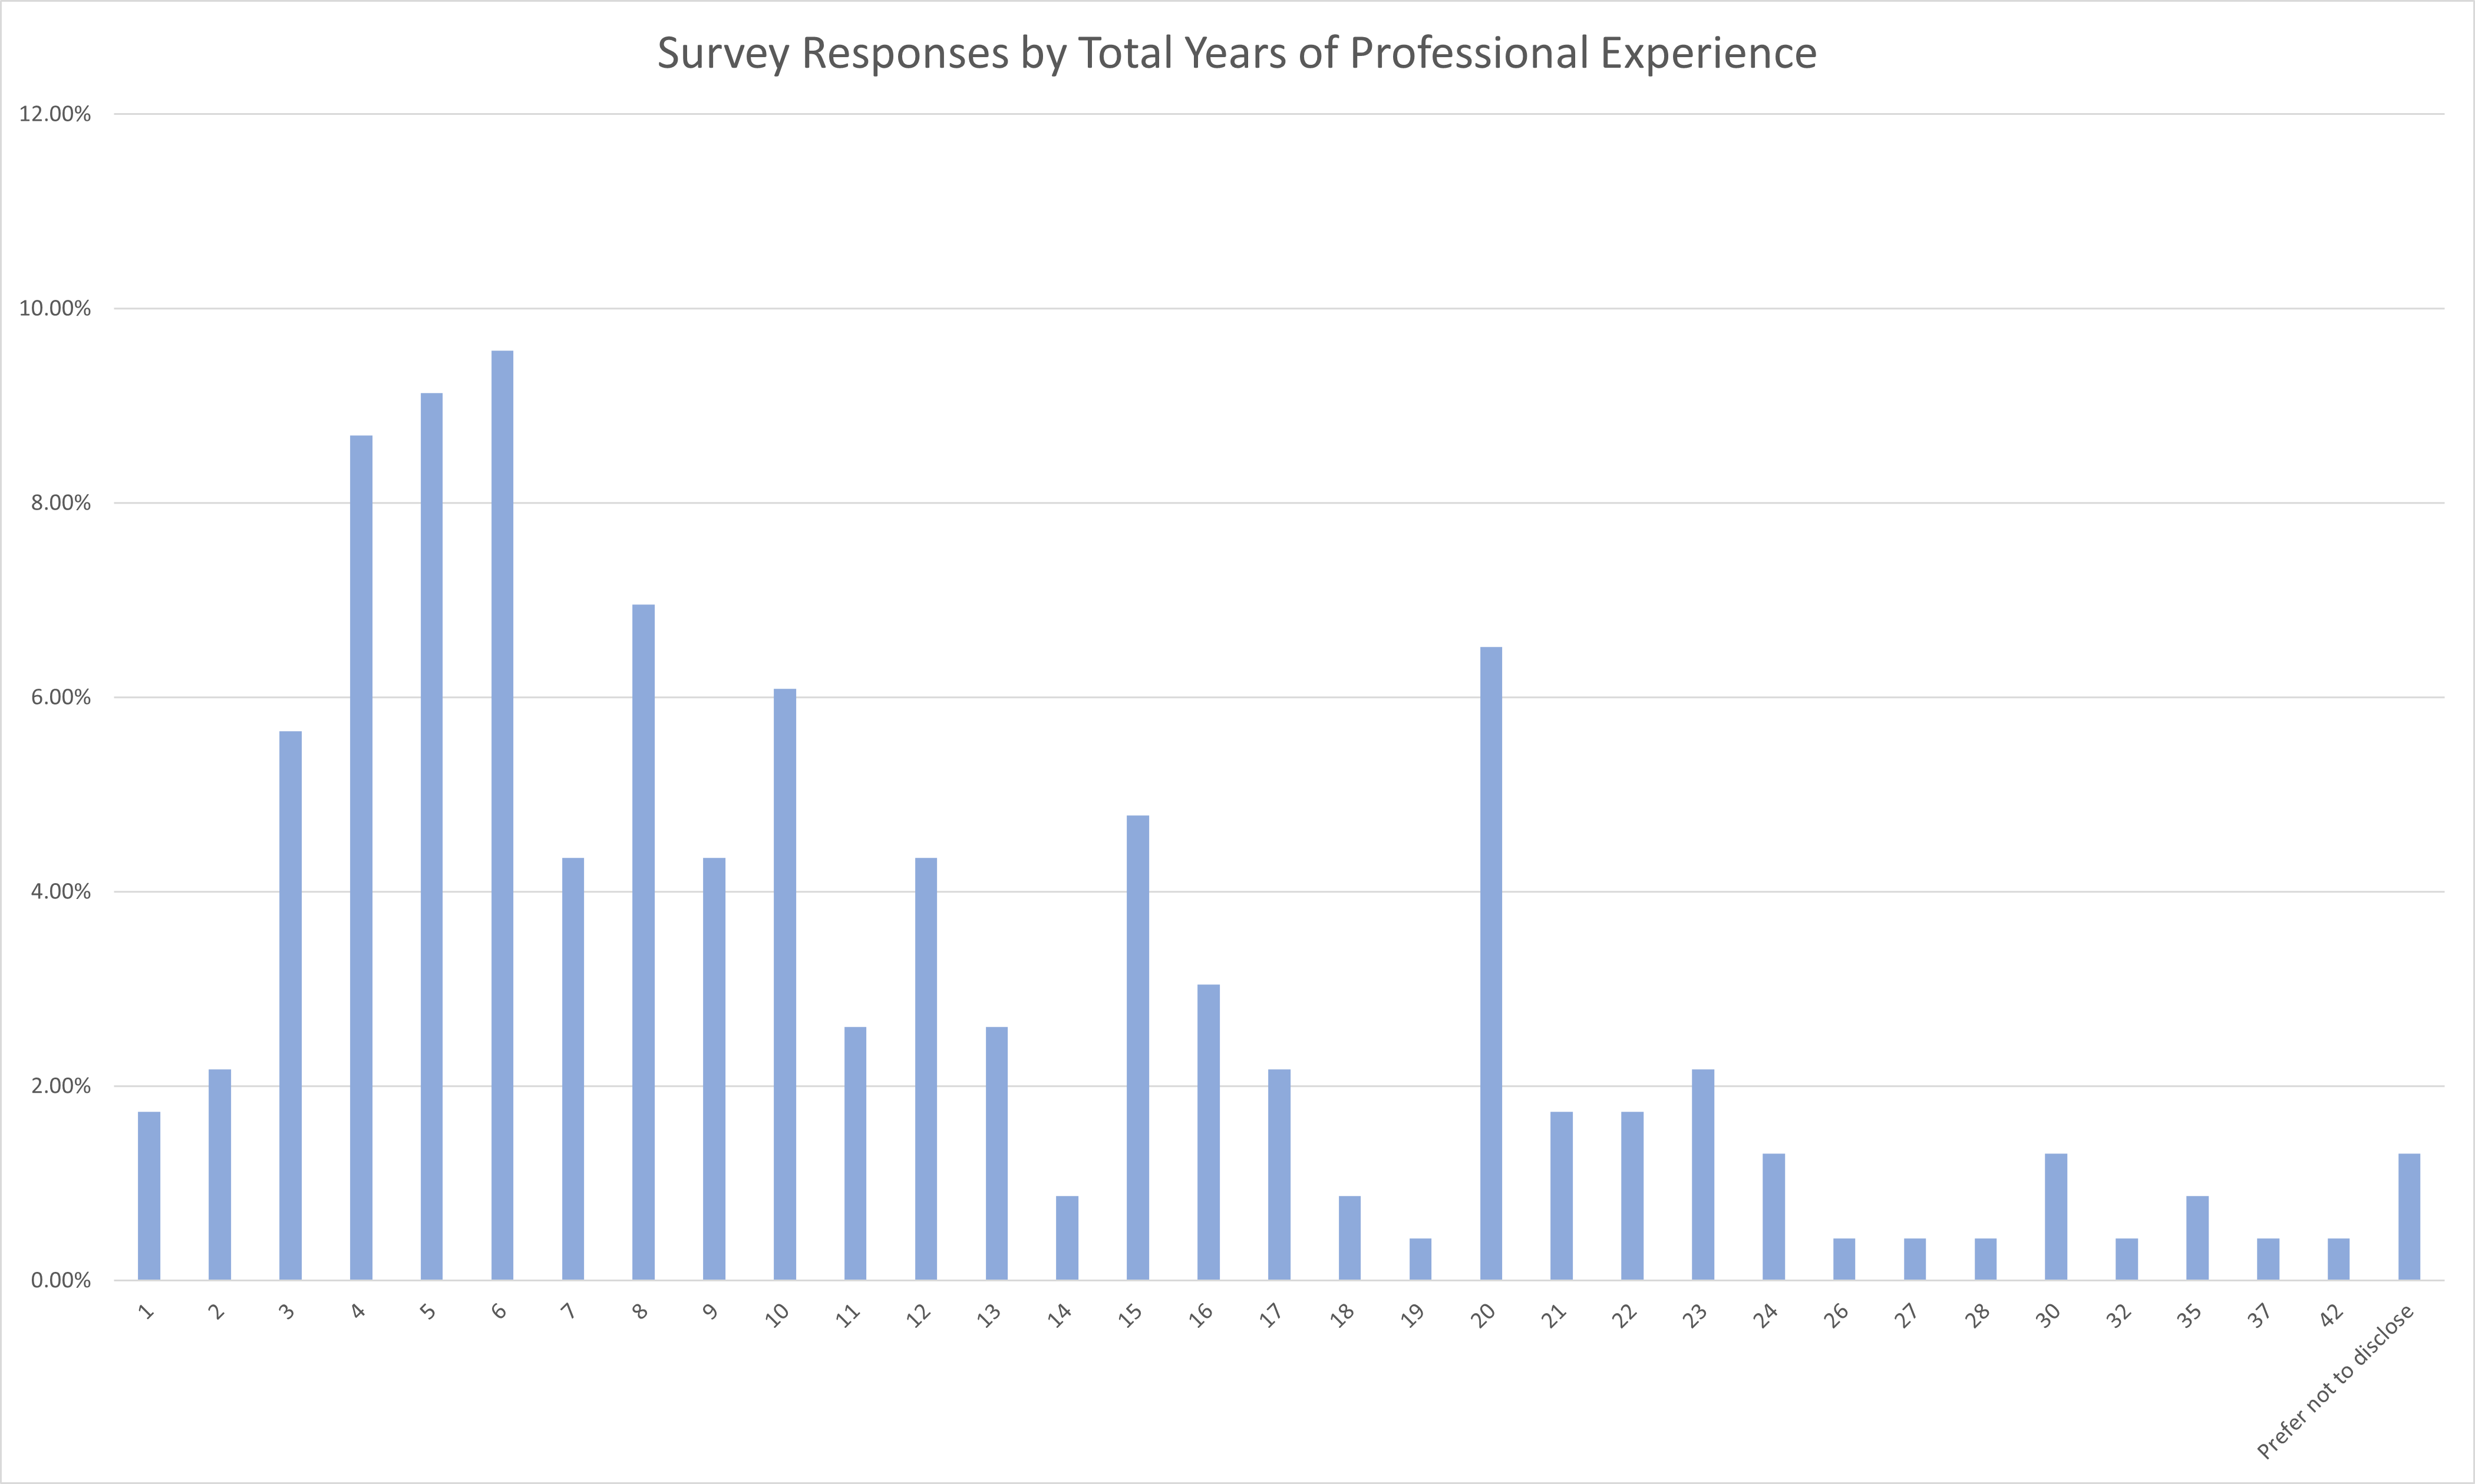
Please indicate the total years of experience you have in the following areas [Total Professional Experience]
Survey Responses by Total Years of Professional Experience
Response
Percent of Respondents
1
1.74%
2
2.17%
3
5.65%
4
8.70%
5
9.13%
6
9.57%
7
4.35%
8
6.96%
9
4.35%
10
6.09%
11
2.61%
12
4.35%
13
2.61%
14
0.87%
15
4.78%
16
3.04%
17
2.17%
18
0.87%
19
0.43%
20
6.52%
21
1.74%
22
1.74%
23
2.17%
24
1.30%
26
0.43%
27
0.43%
28
0.43%
30
1.30%
32
0.43%
35
0.87%
37
0.43%
42
0.43%
Prefer not to disclose
1.30%
Please indicate the total years of experience you have in the following areas [In the IT Field]
Survey Responses by Total Years of IT Experience
Response
Percent of Respondents
0
0.43%
1
1.74%
2
2.17%
3
8.70%
4
9.13%
5
11.74%
6
8.26%
7
3.04%
8
6.09%
9
5.22%
10
10.43%
11
1.74%
12
2.61%
13
2.61%
14
0.87%
15
3.91%
16
1.74%
17
1.74%
18
1.30%
20
4.35%
21
1.74%
22
1.30%
23
1.30%
24
1.30%
25
1.74%
27
0.43%
30
0.87%
42
0.43%
Prefer not to disclose
3.04%
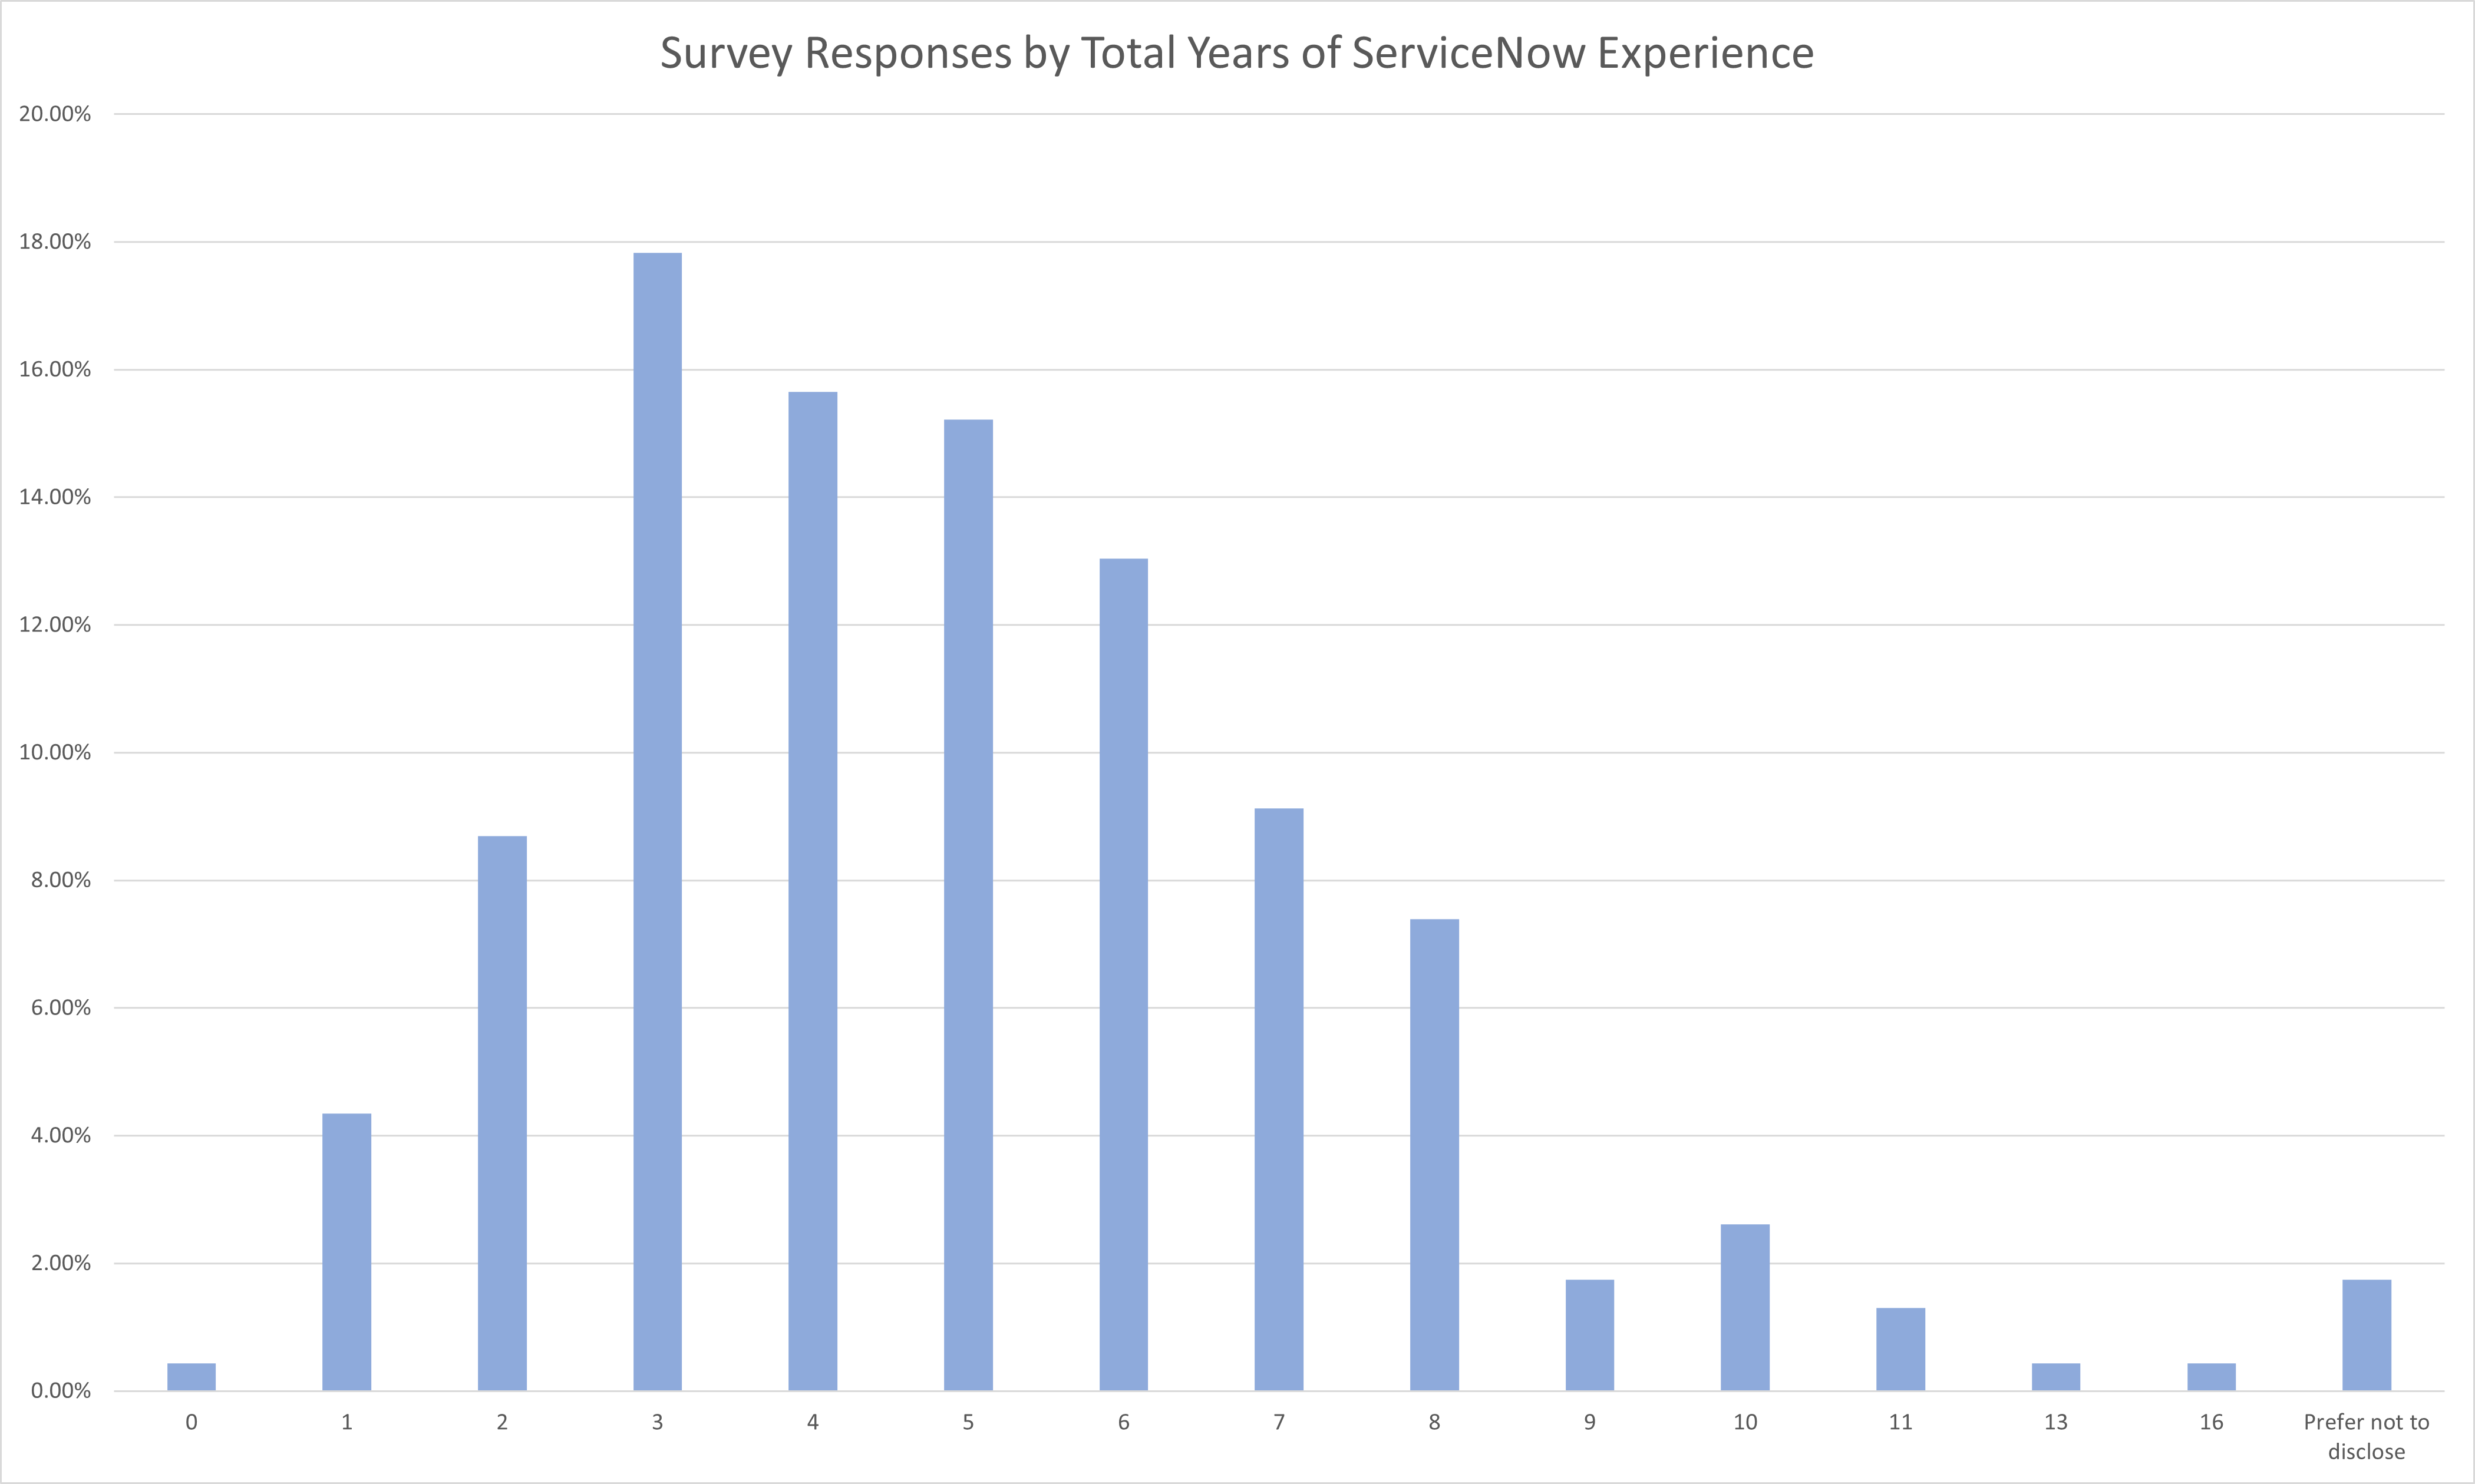
Survey Responses by Total Years of ServiceNow Experience
Response
Percent of Respondents
0
0.43%
1
4.35%
2
8.70%
3
17.83%
4
15.65%
5
15.22%
6
13.04%
7
9.13%
8
7.39%
9
1.74%
10
2.61%
11
1.30%
13
0.43%
16
0.43%
Prefer not to disclose
1.74%
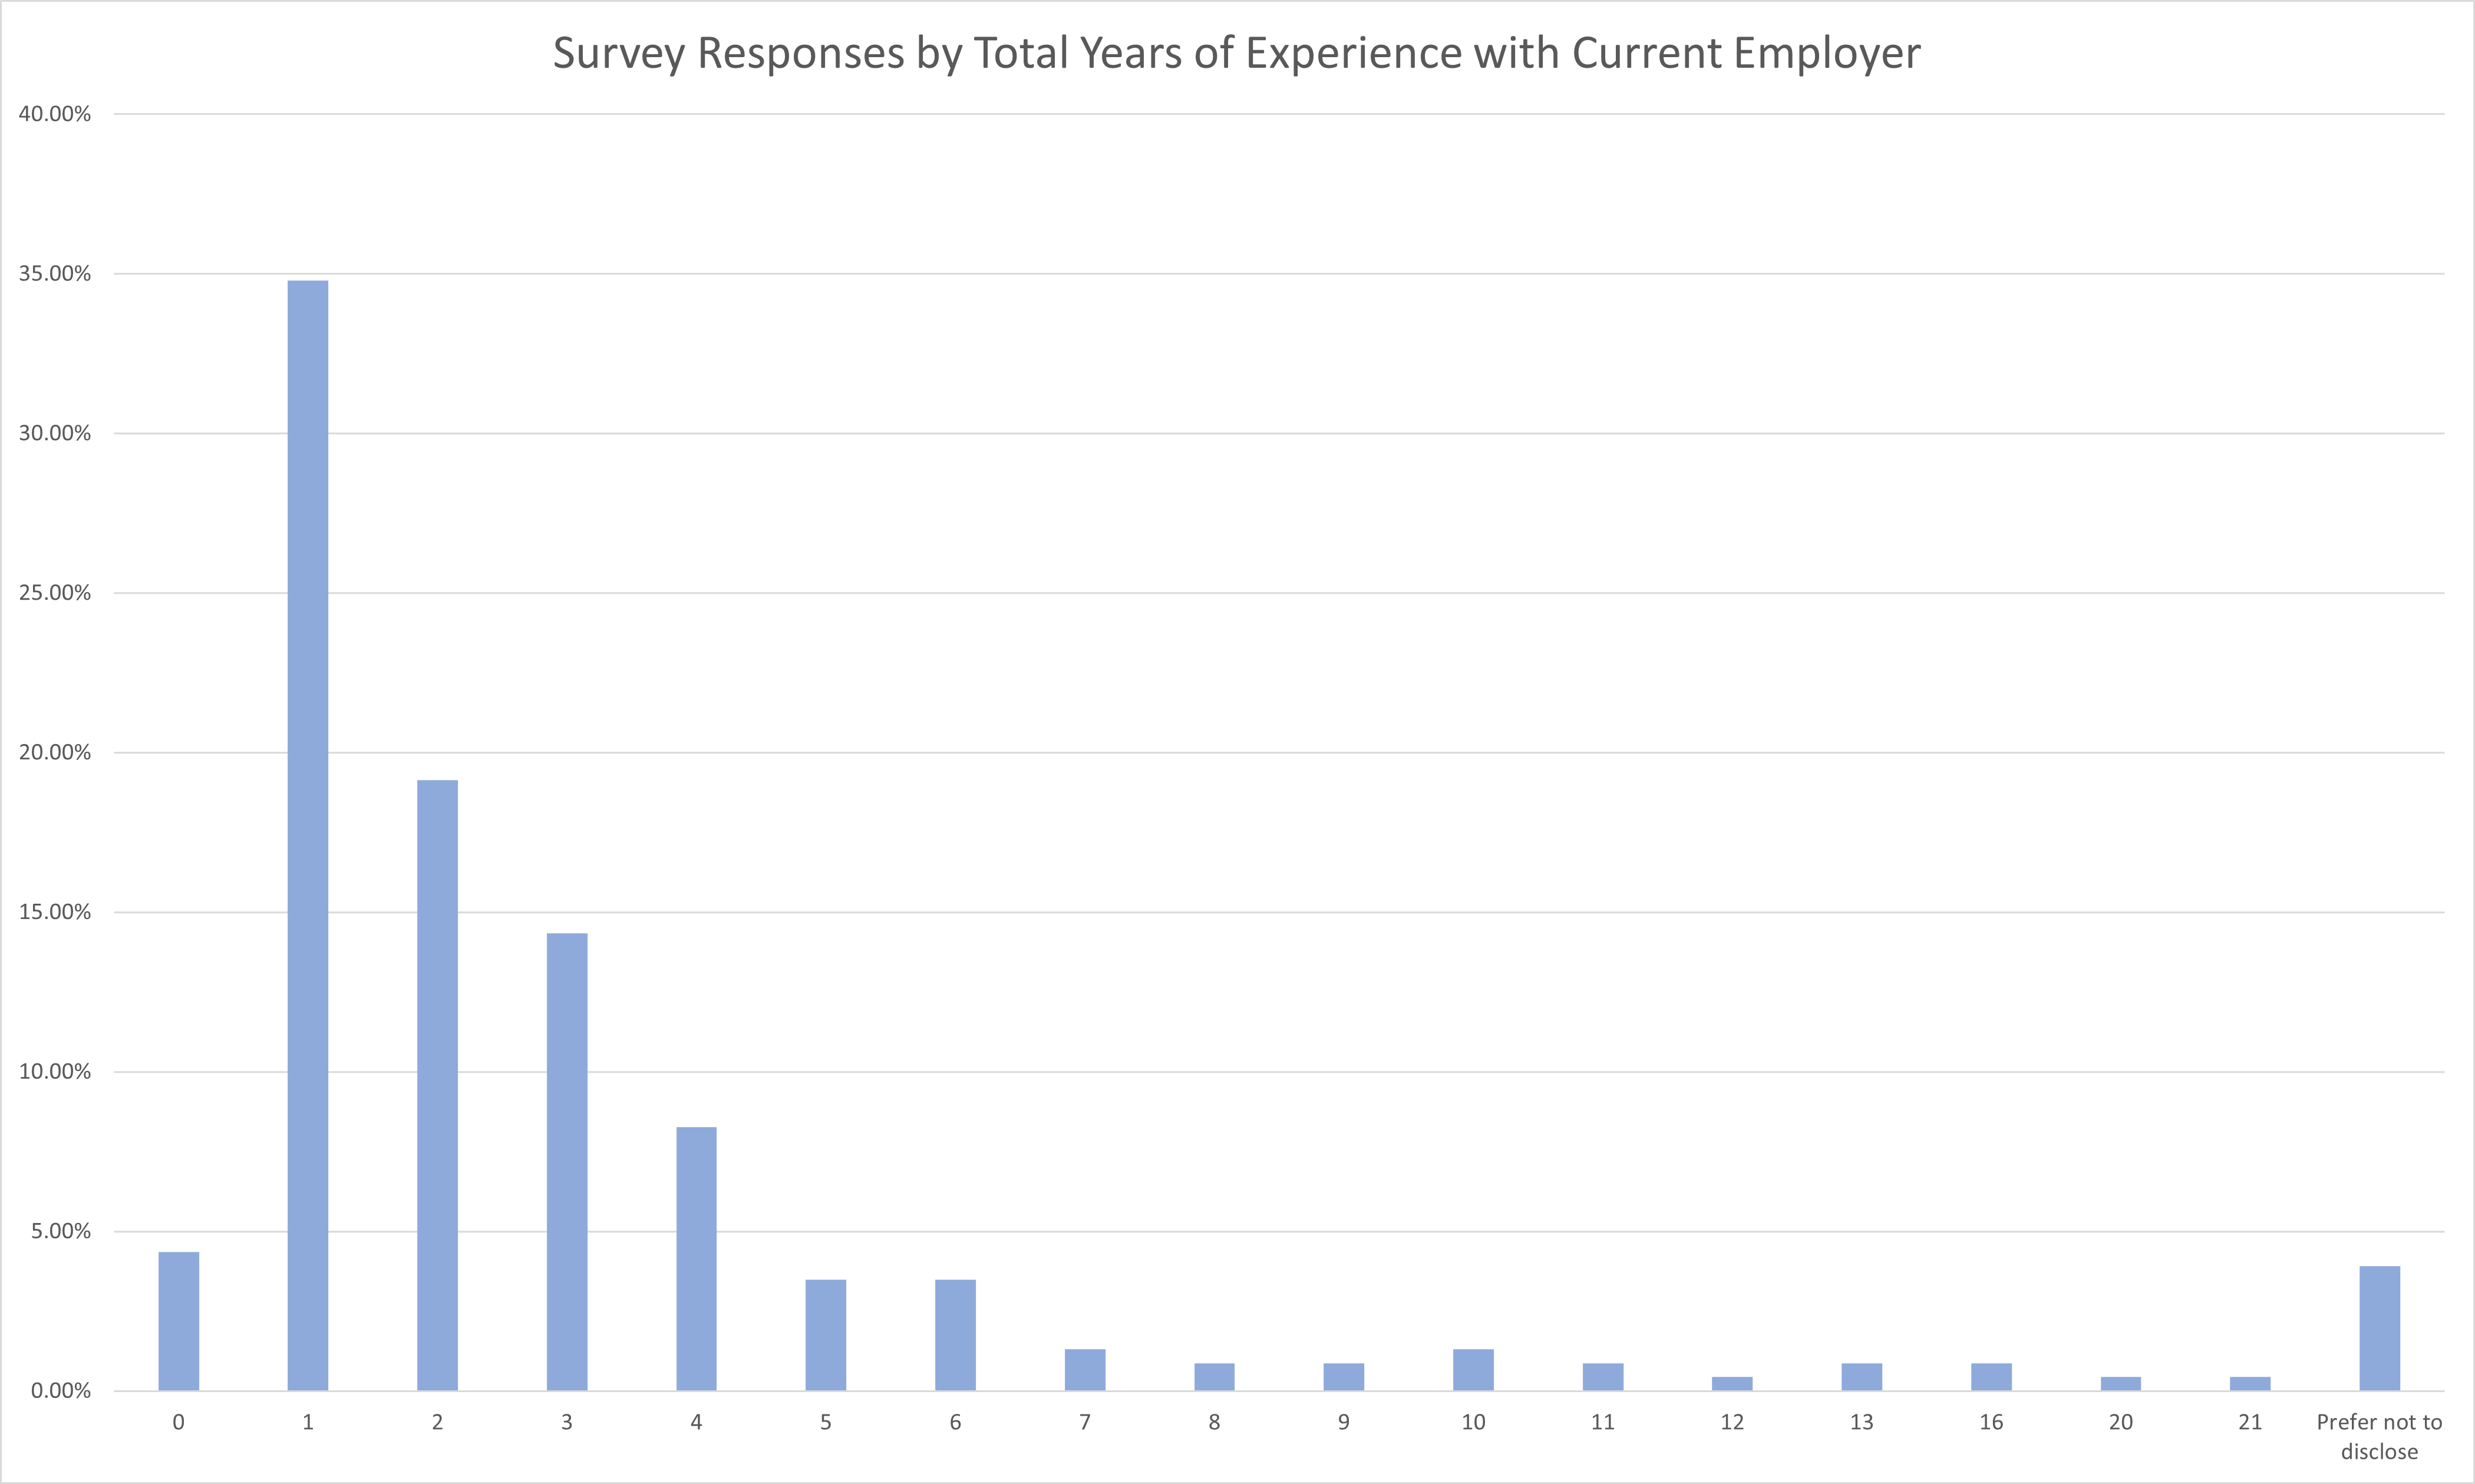
Please indicate the total years of experience you have in the following areas [With your current employer]
Survey Responses by Total Years of Experience with Current Employer
Response
Percent of Respondents
0
4.35%
1
34.78%
2
19.13%
3
14.35%
4
8.26%
5
3.48%
6
3.48%
7
1.30%
8
0.87%
9
0.87%
10
1.30%
11
0.87%
12
0.43%
13
0.87%
16
0.87%
20
0.43%
21
0.43%
Prefer not to disclose
3.91%
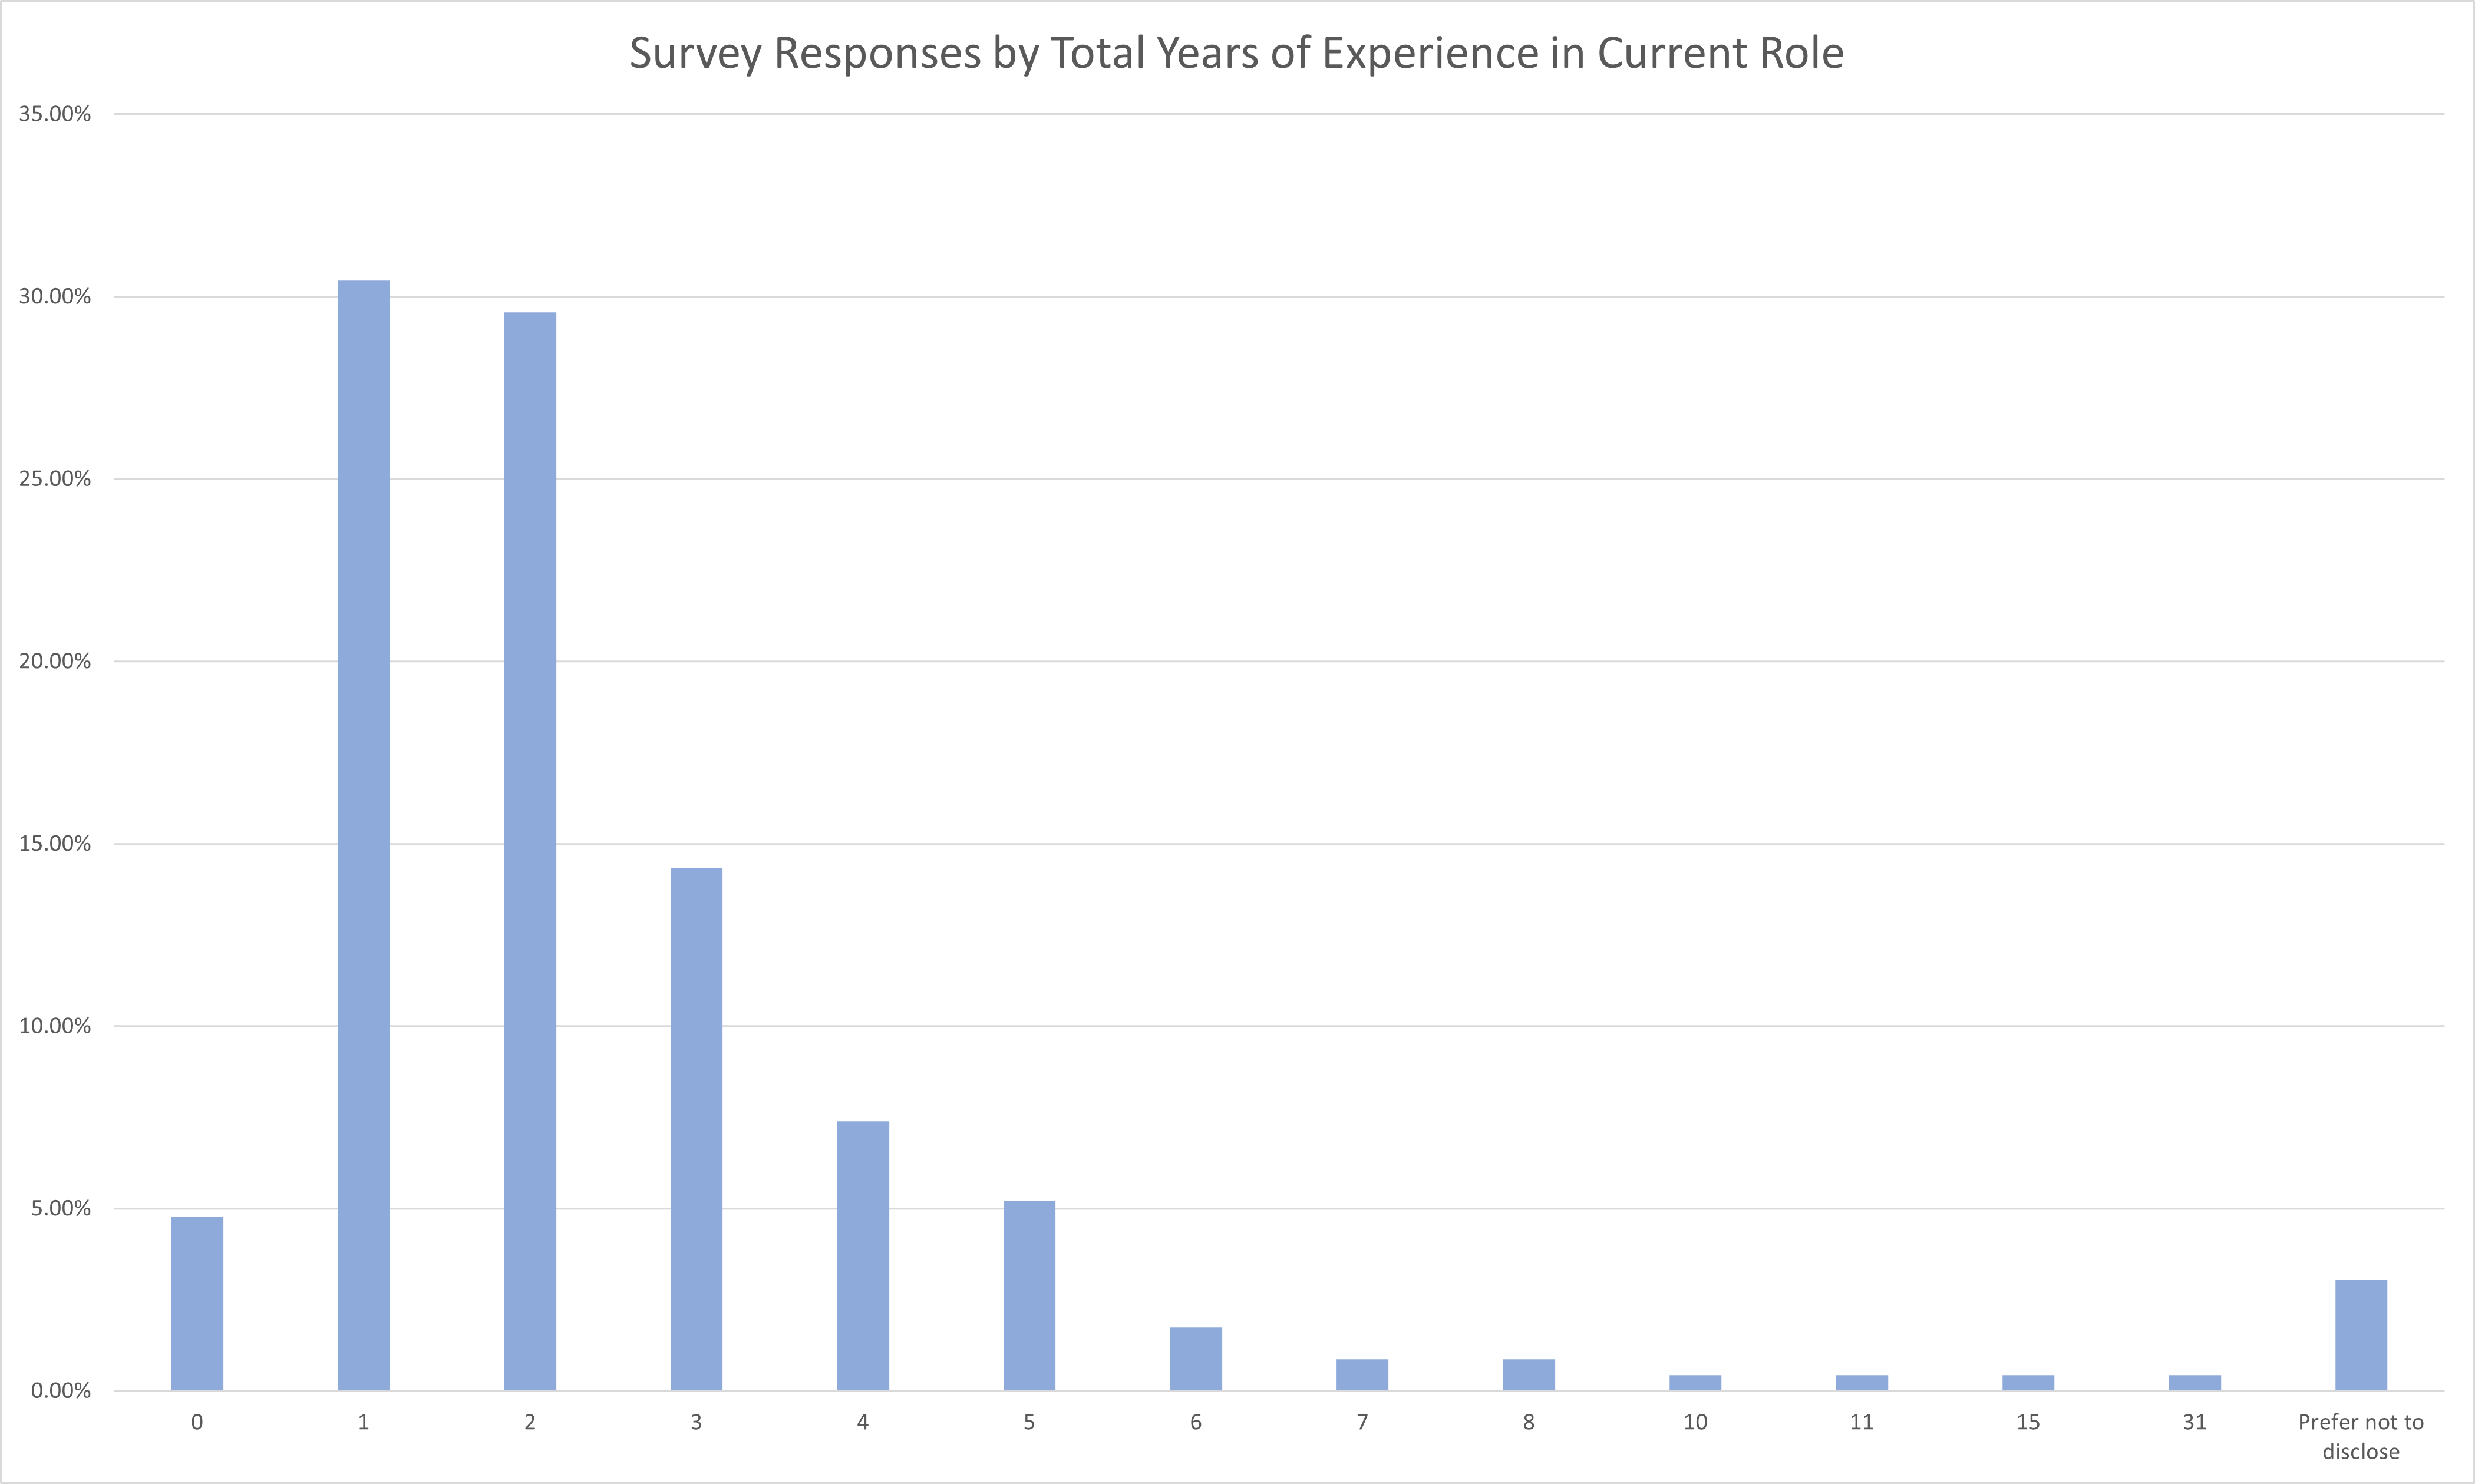
Please indicate the total years of experience you have in the following areas [In your current role]
Survey Responses by Total Years of Experience in Current Role
Response
Percent of Respondents
0
4.78%
1
30.43%
2
29.57%
3
14.35%
4
7.39%
5
5.22%
6
1.74%
7
0.87%
8
0.87%
10
0.43%
11
0.43%
15
0.43%
31
0.43%
Prefer not to disclose
3.04%
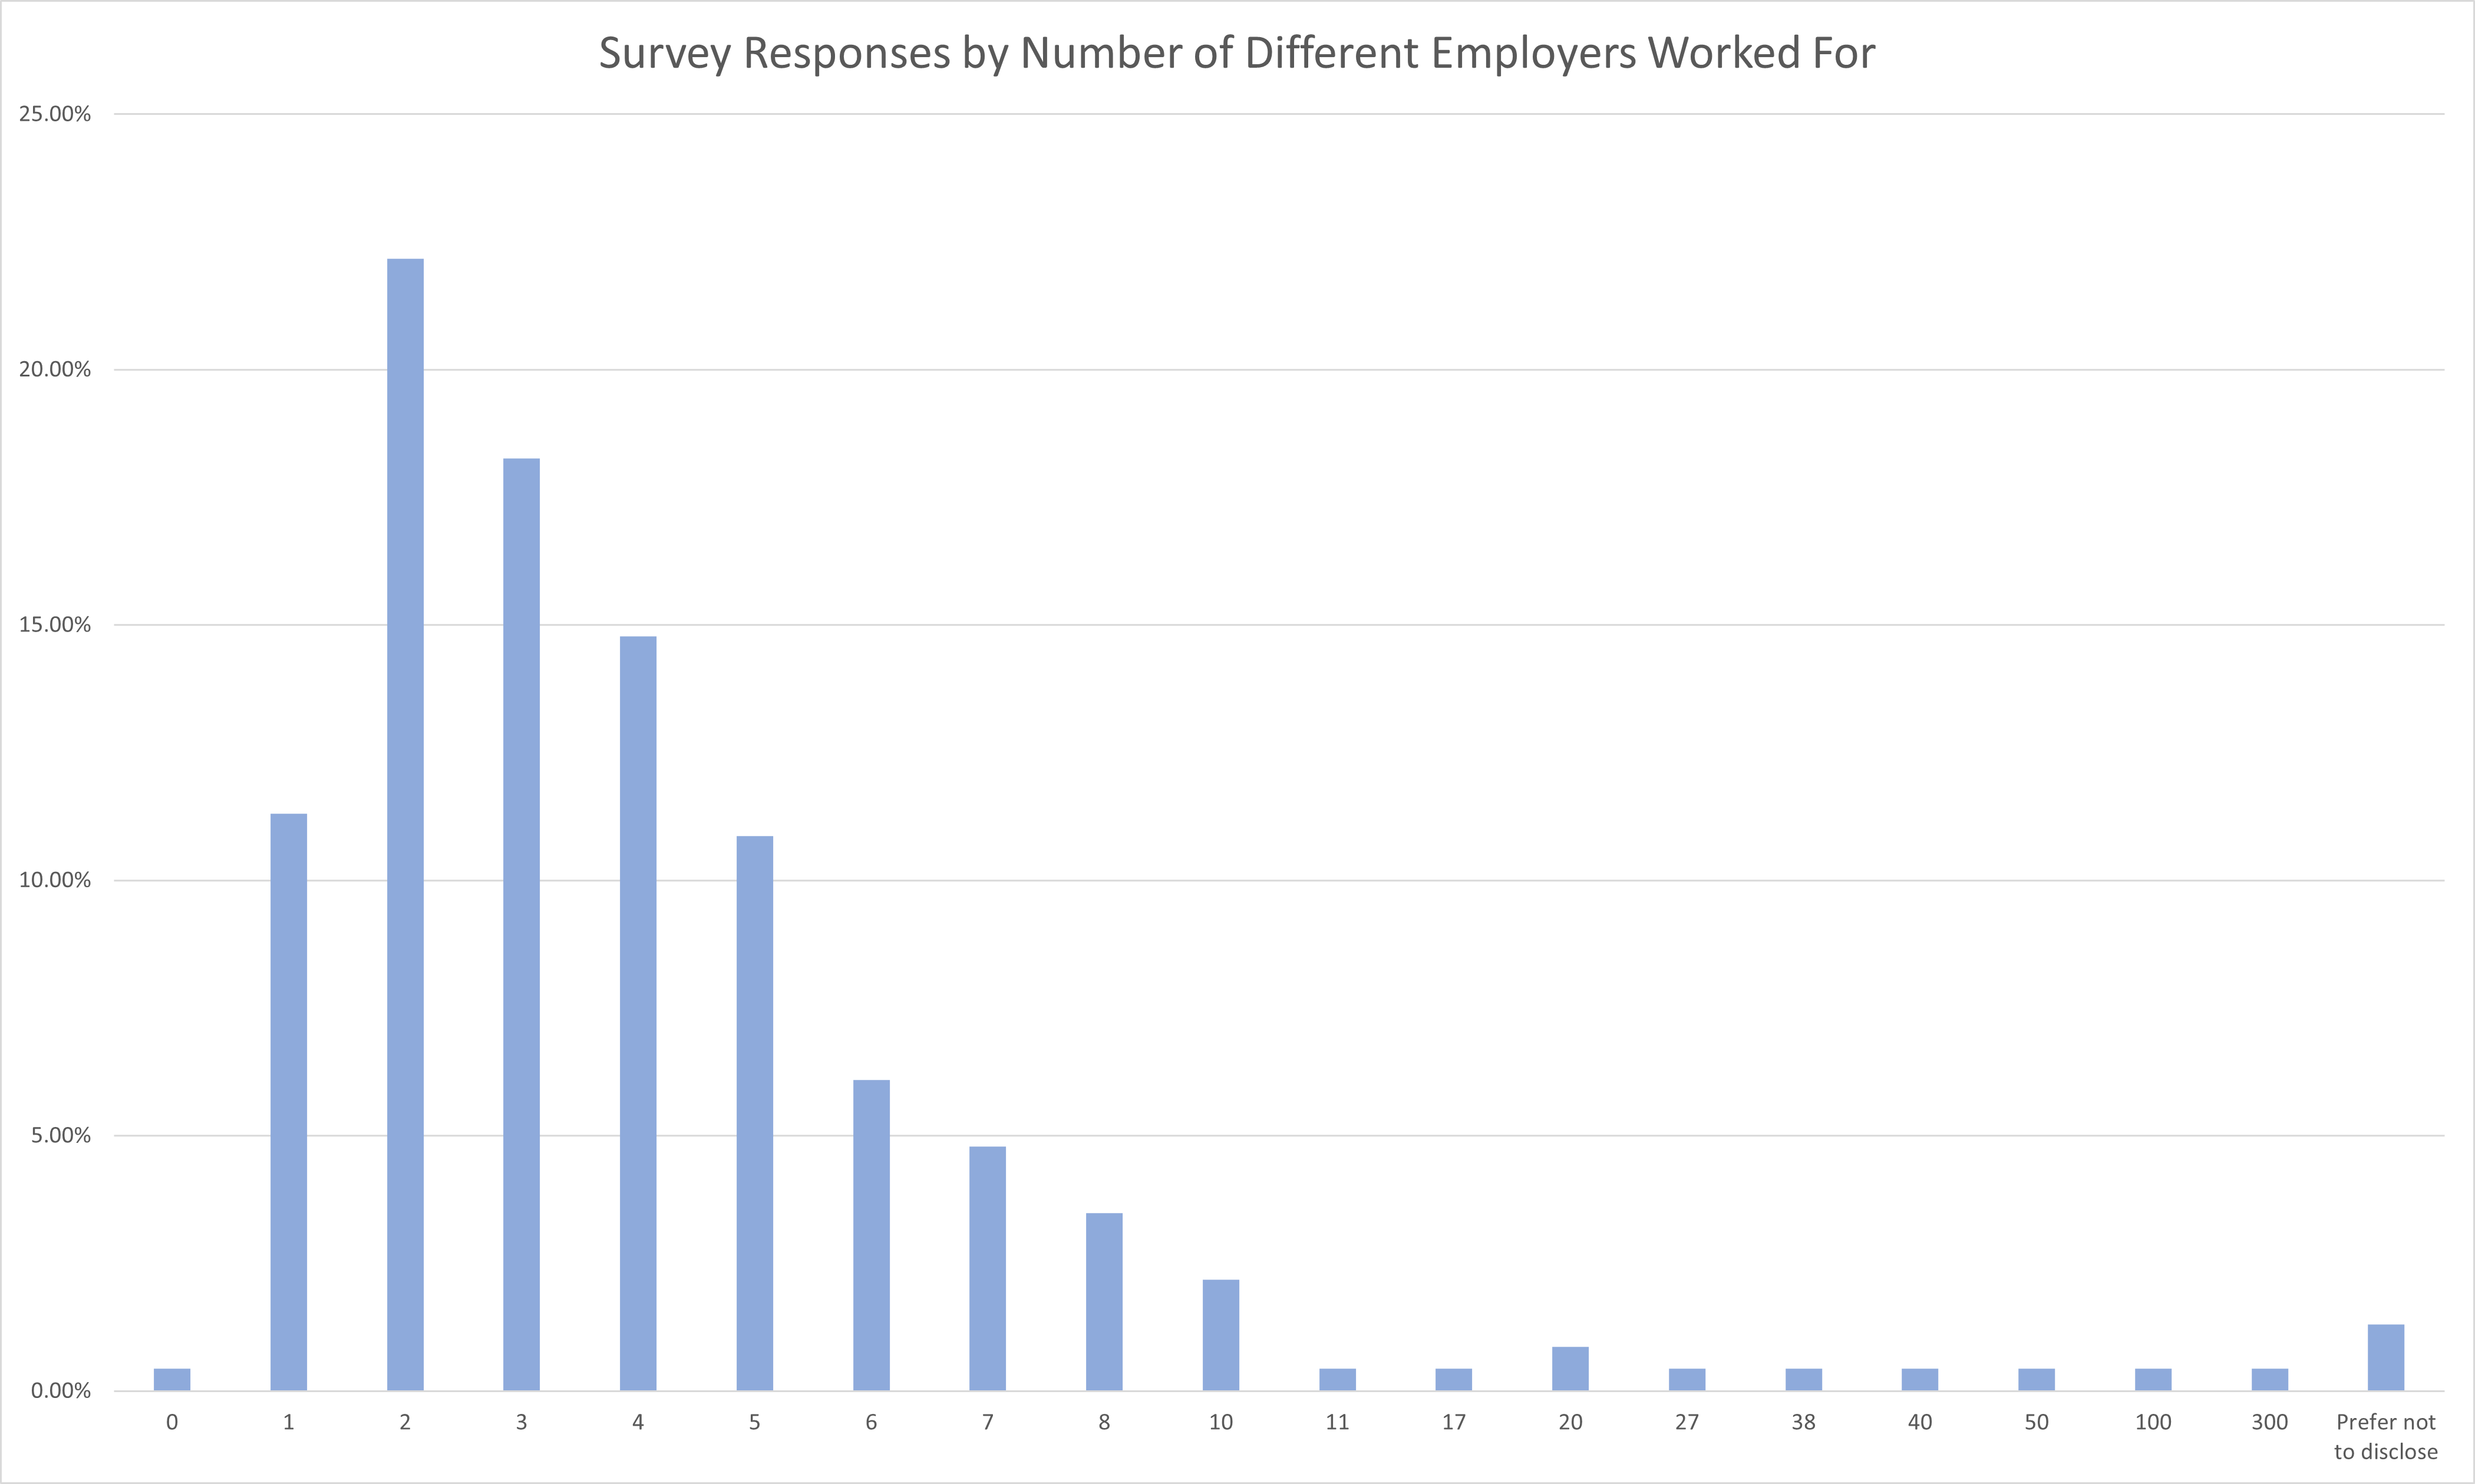
How many different employers have you worked for in your career?
Survey Responses by Number of Employers Worked For
Response
Percent of Respondents
0
0.43%
1
11.30%
2
22.17%
3
18.26%
4
14.78%
5
10.87%
6
6.09%
7
4.78%
8
3.48%
10
2.17%
11
0.43%
17
0.43%
20
0.87%
27
0.43%
38
0.43%
40
0.43%
50
0.43%
100
0.43%
300
0.43%
Prefer not to disclose
1.30%
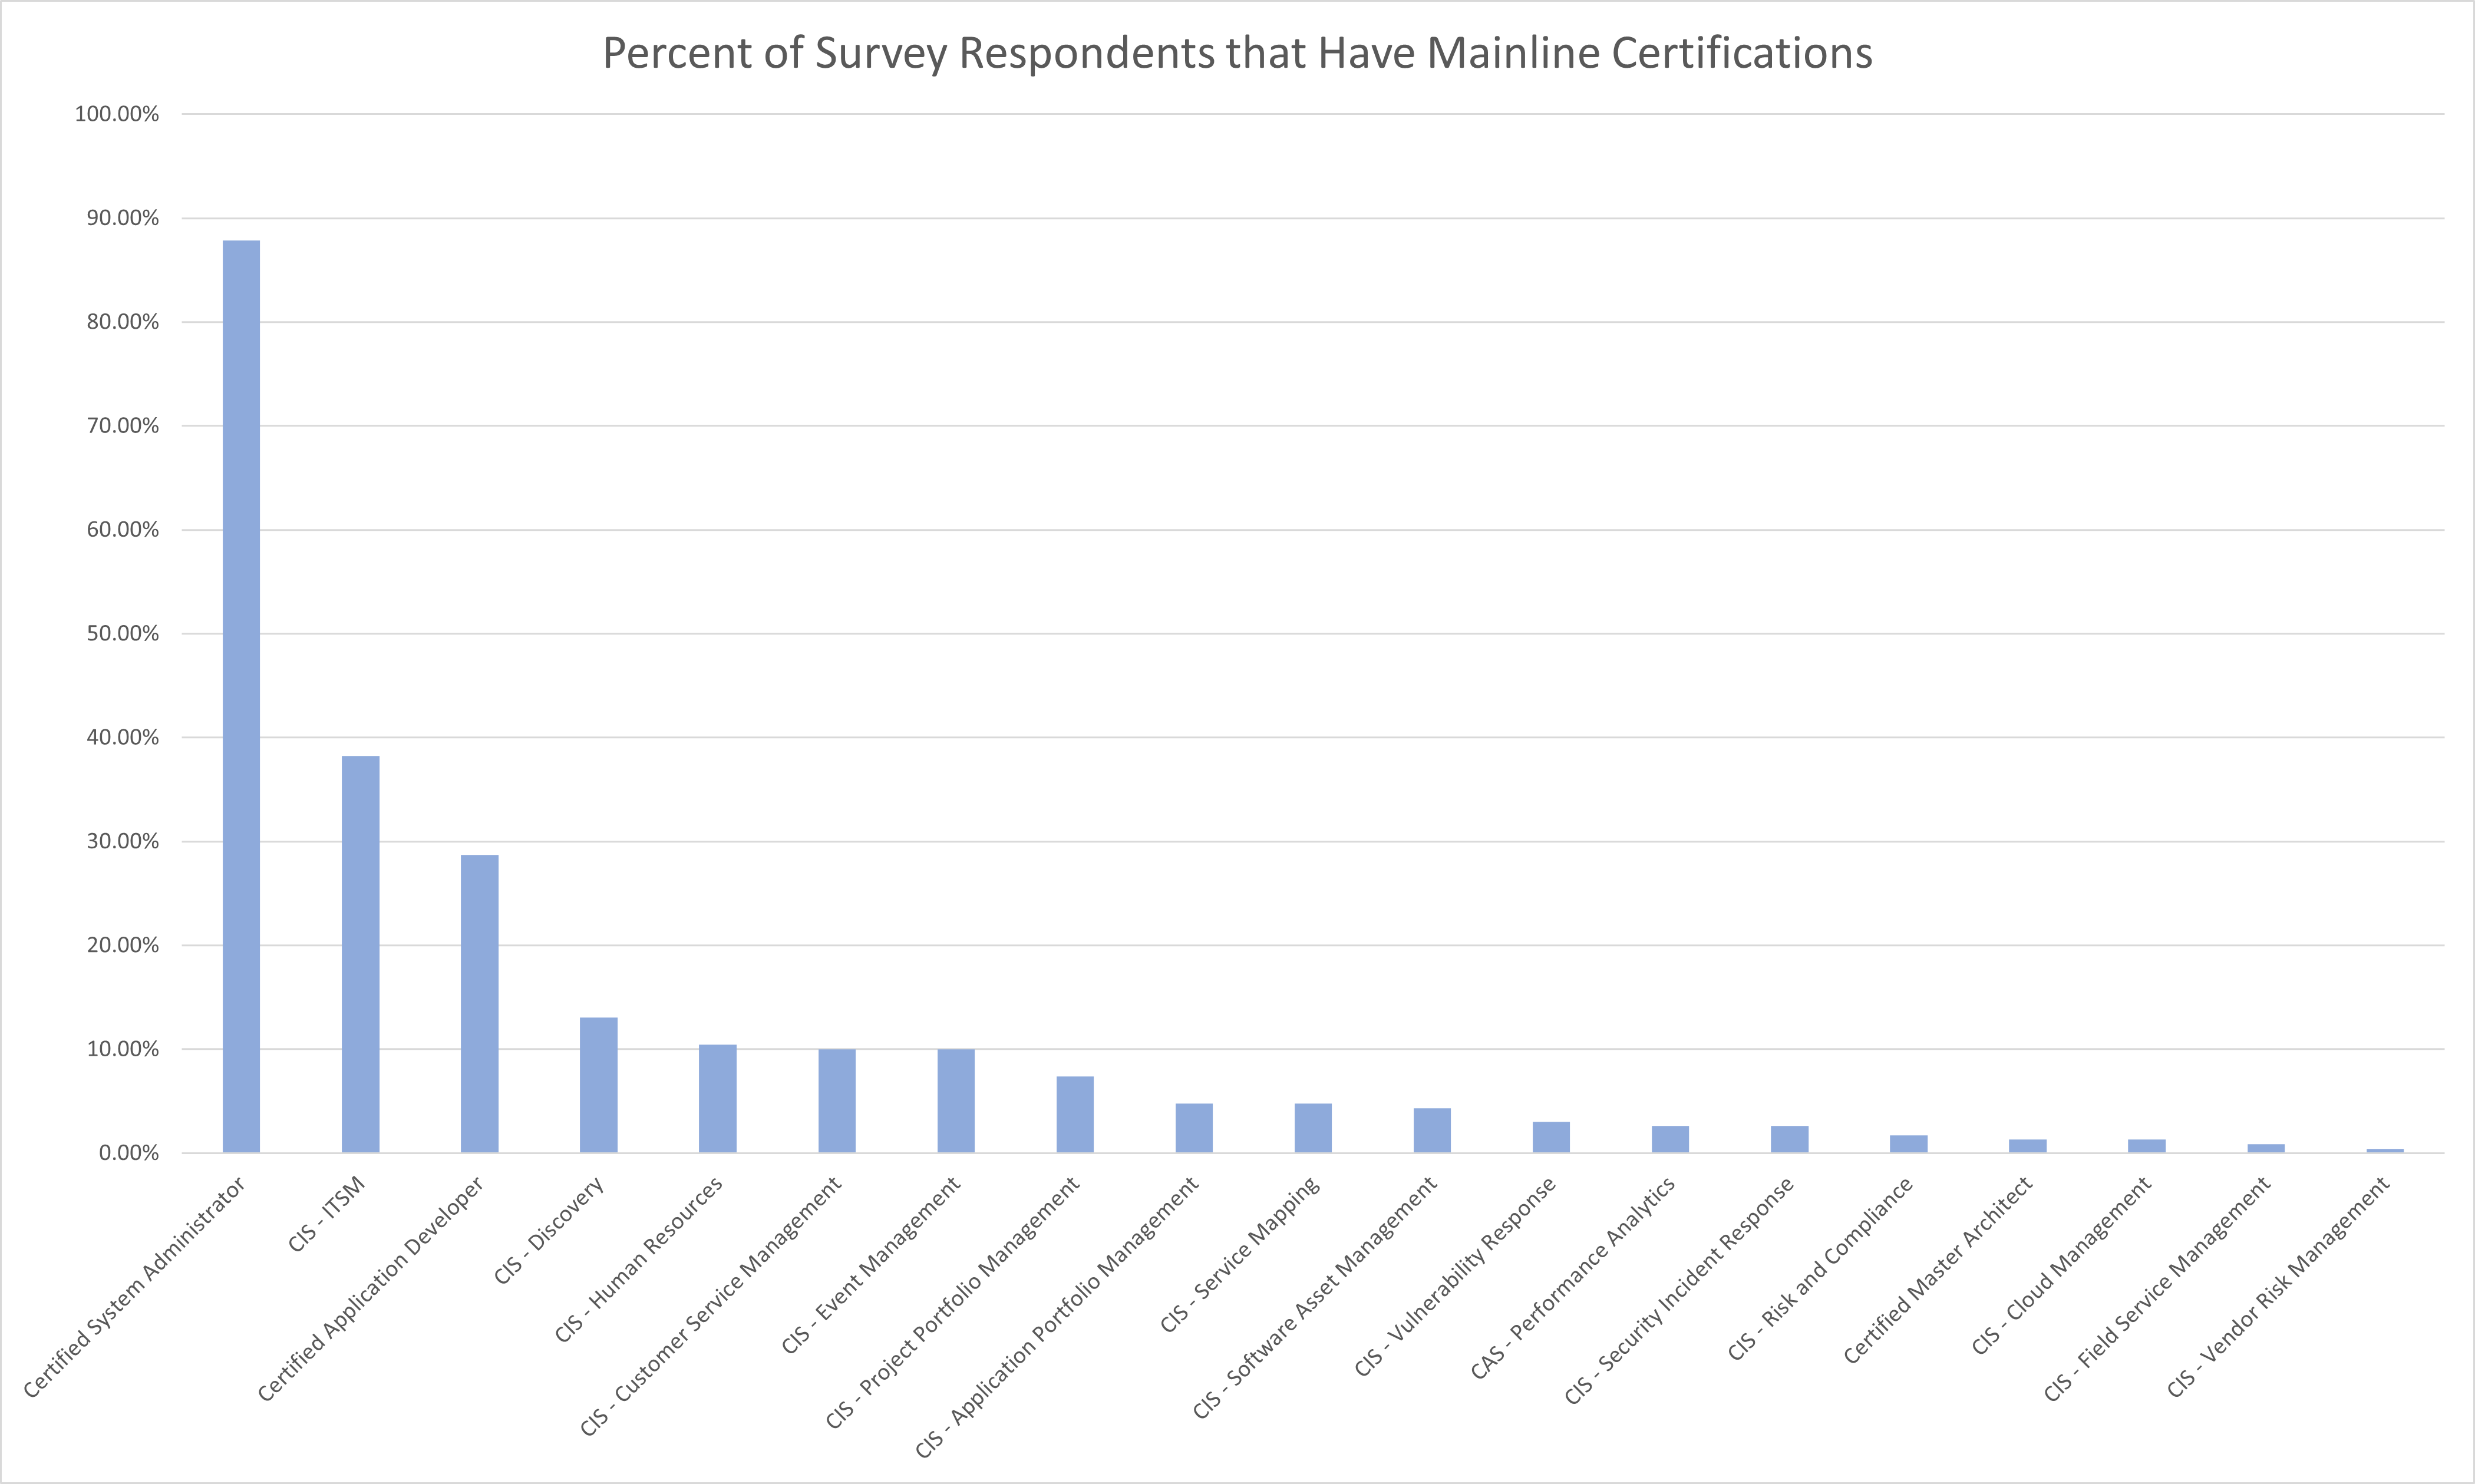
Please select any ServiceNow certifications that you currently possess
The following summarizes each ServiceNow Mainline Certificaiton and the percentage of respondents who indicated that they have the certification.
Percent of Survey Respondents that Have Mainline Certifications
Response
Percent of Respondents
Certified System Administrator
87.83%
CIS - ITSM
38.26%
Certified Application Developer
28.70%
CIS - Discovery
13.04%
CIS - Human Resources
10.43%
CIS - Customer Service Management
10.00%
CIS - Event Management
10.00%
CIS - Project Portfolio Management
7.39%
CIS - Application Portfolio Management
4.78%
CIS - Service Mapping
4.78%
CIS - Software Asset Management
4.35%
CIS - Vulnerability Response
3.04%
CAS - Performance Analytics
2.61%
CIS - Security Incident Response
2.61%
CIS - Risk and Compliance
1.74%
Certified Master Architect
1.30%
CIS - Cloud Management
1.30%
CIS - Field Service Management
0.87%
CIS - Vendor Risk Management
0.43%
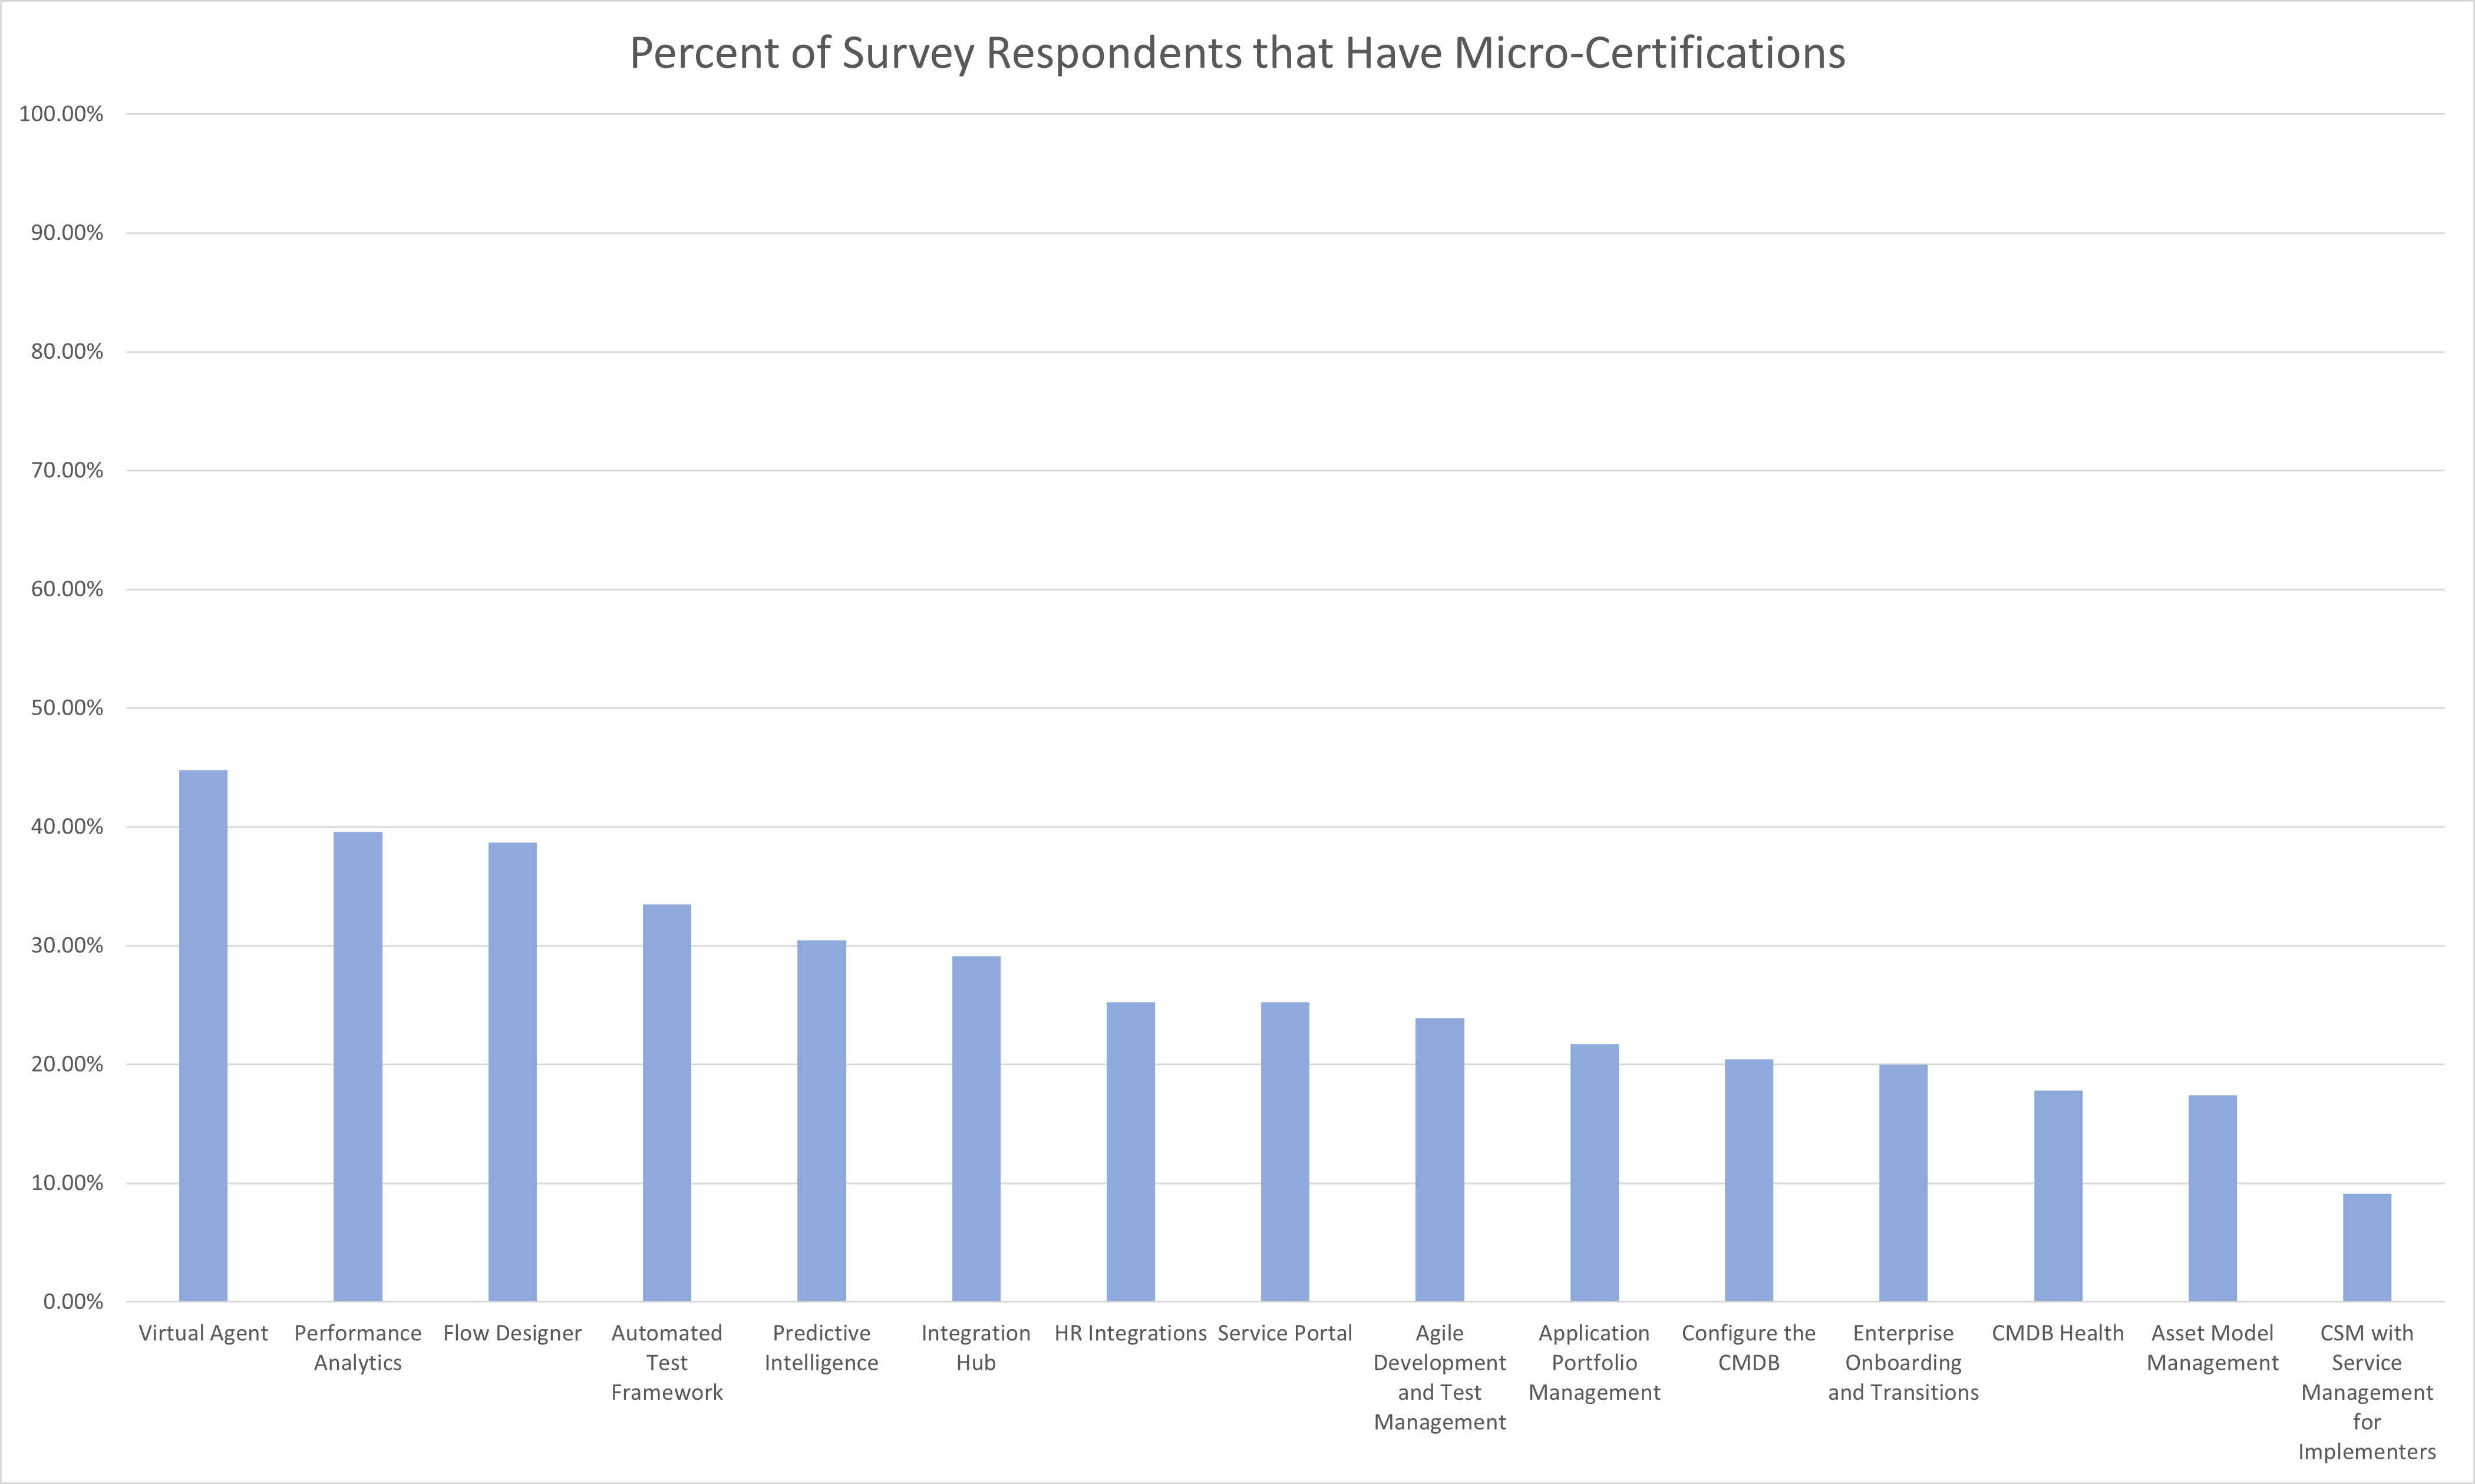
Please select any ServiceNow micro-certifications that you currently possess
The following summarizes each ServiceNow Micro-Certificaiton and the percentage of respondents who indicated that they have the certification.
Percent of Survey Respondents that Have Micro-Certifications
Response
Percent of Respondents
Virtual Agent
44.78%
Performance Analytics
39.57%
Flow Designer
38.70%
Automated Test Framework
33.48%
Predictive Intelligence
30.43%
Integration Hub
29.13%
HR Integrations
25.22%
Service Portal
25.22%
Agile Development and Test Management
23.91%
Application Portfolio Management
21.74%
Configure the CMDB
20.43%
Enterprise Onboarding and Transitions
20.00%
CMDB Health
17.83%
Asset Model Management
17.39%
CSM with Service Management for Implementers
9.13%
Please select any Professional certifications that you currently possess
The following summarizes each Professional Certificaiton and the percentage of respondents who indicated that they have the certification.
Percent of Survey Respondents that Have Professional Certifications
Response
Percent of Respondents
ITIL Foundation
19.57%
ITIL Above Foundation
2.17%
Professional Scrum Master
2.17%
Certified Scrum Master
2.17%
Six-Sigma
1.30%
PMP
1.30%
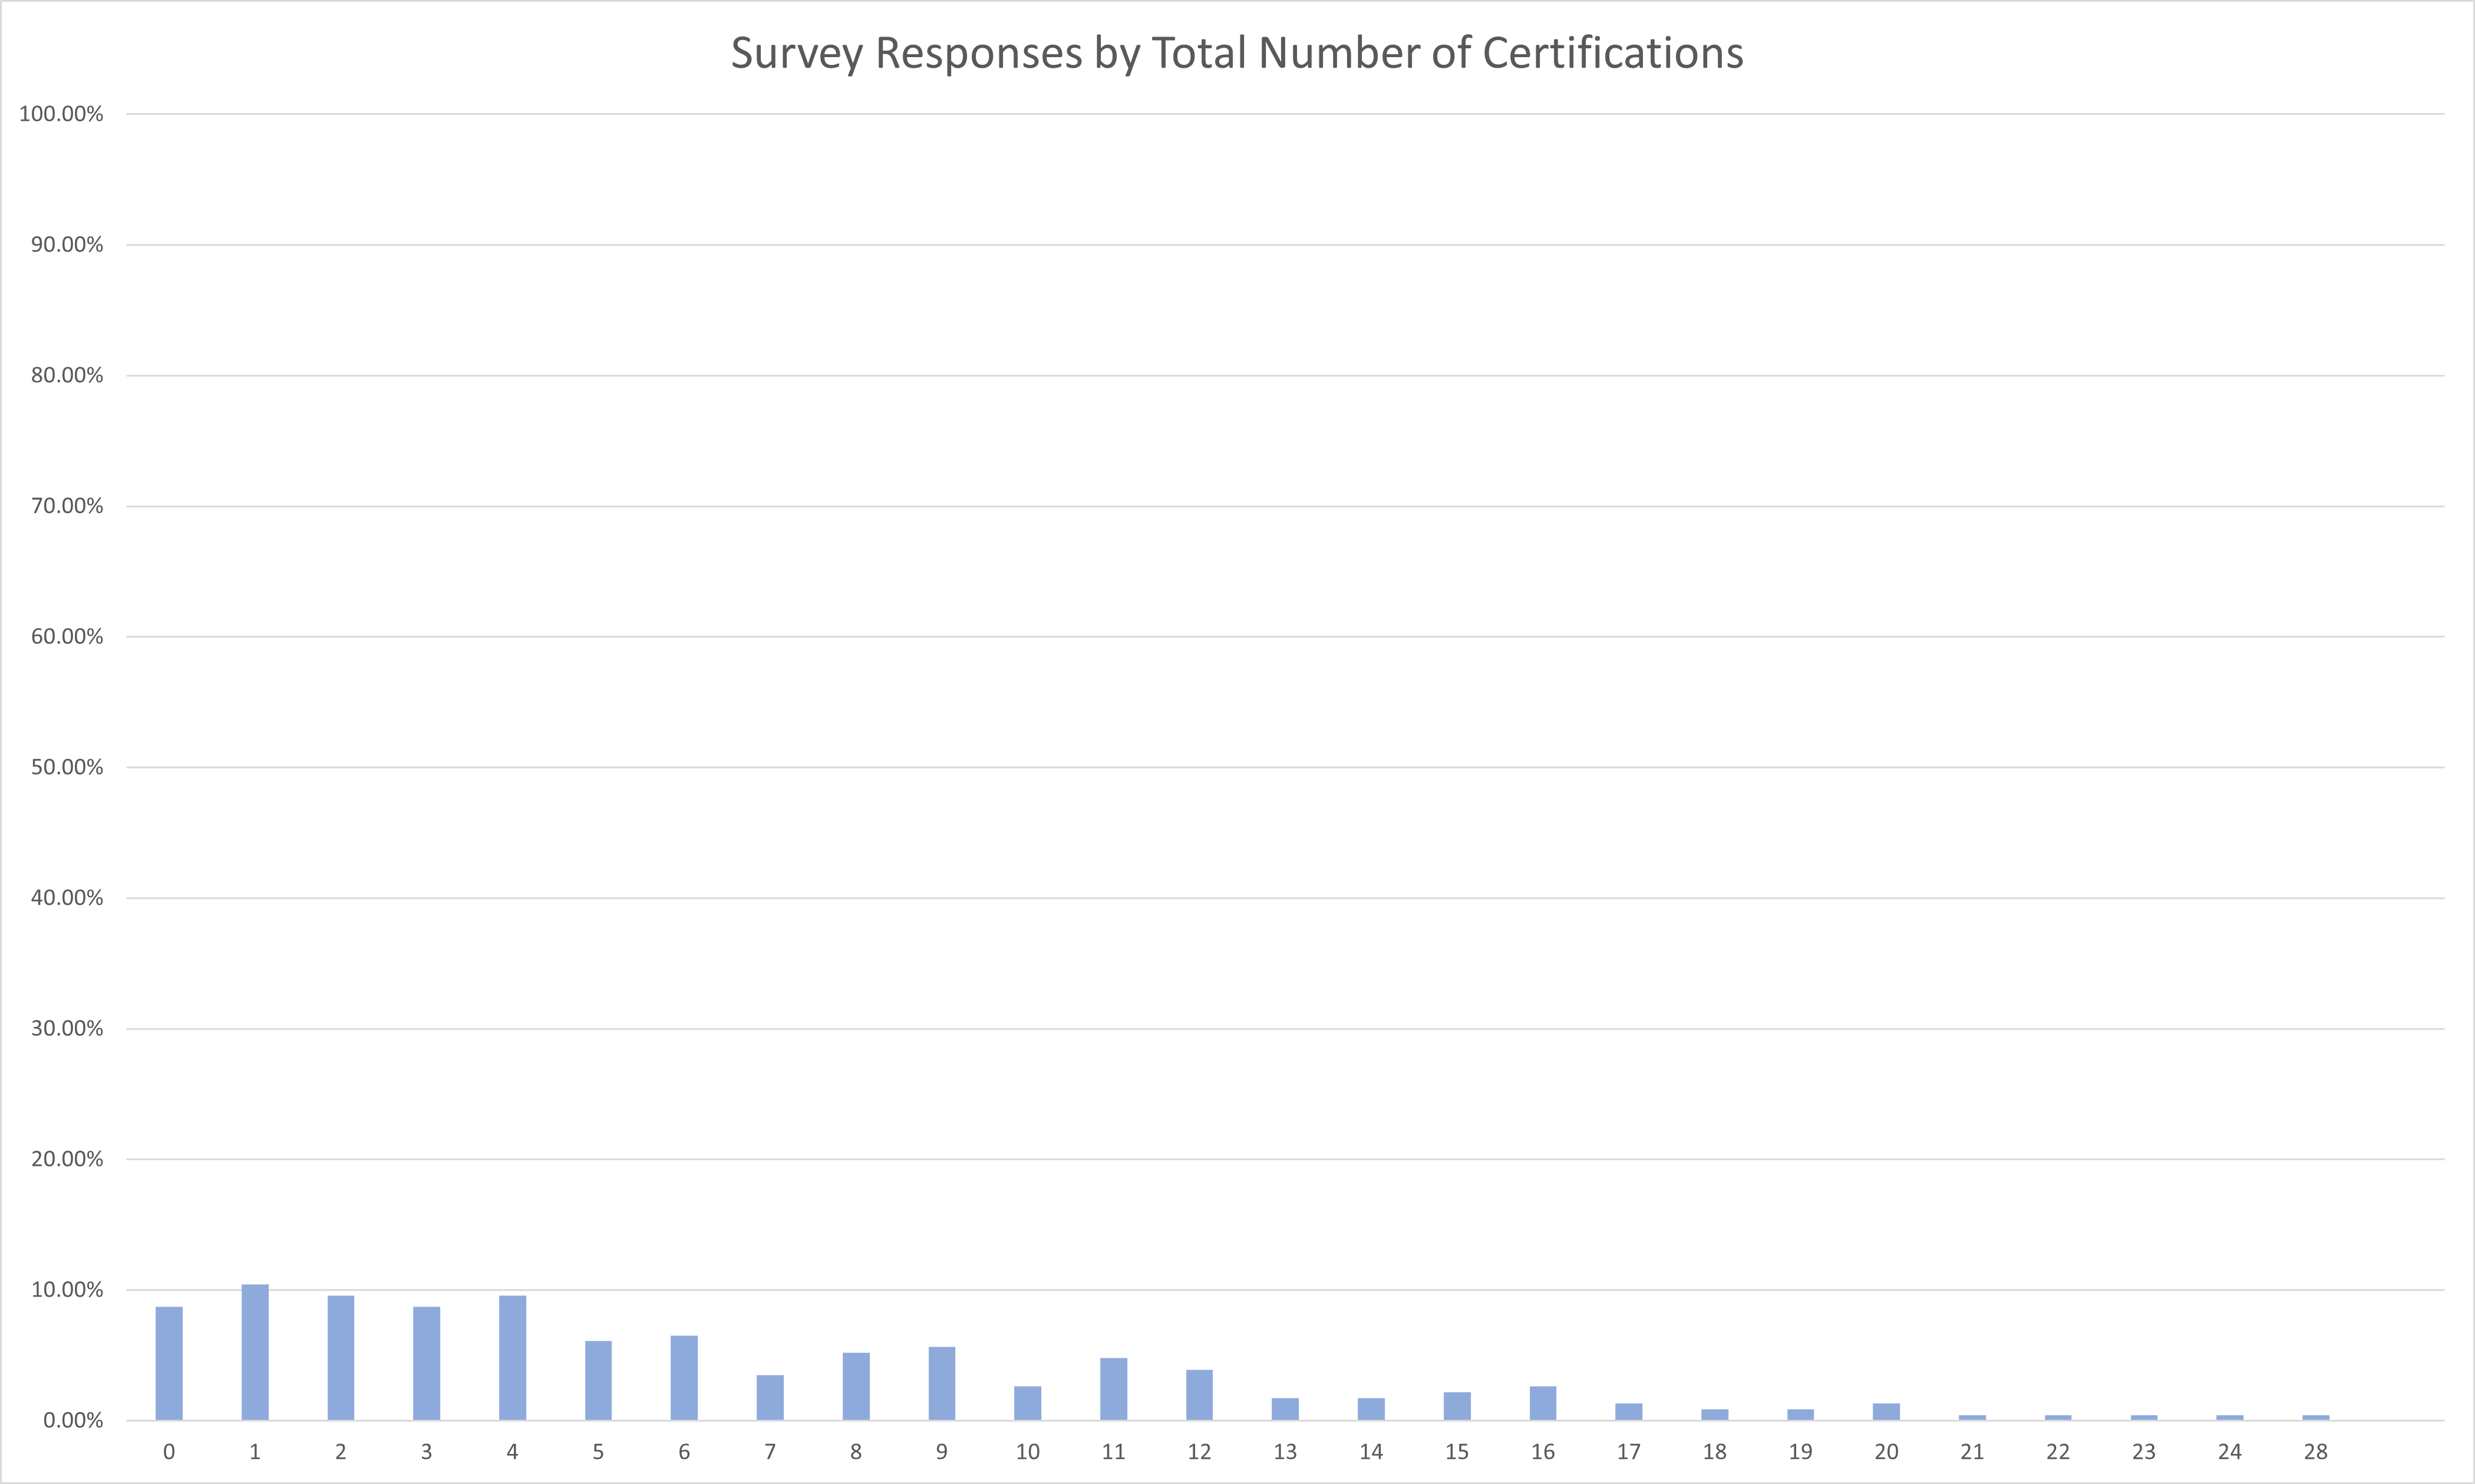
Survey Responses by Total Number of Certifications
The results of this question were inferred from responses to:
Survey Responses by Total Number of Certifications
Response
Percent of Respondents
0
8.70%
1
10.43%
2
9.57%
3
8.70%
4
9.57%
5
6.09%
6
6.52%
7
3.48%
8
5.22%
9
5.65%
10
2.61%
11
4.78%
12
3.91%
13
1.74%
14
1.74%
15
2.17%
16
2.61%
17
1.30%
18
0.87%
19
0.87%
20
1.30%
21
0.43%
22
0.43%
23
0.43%
24
0.43%
28
0.43%
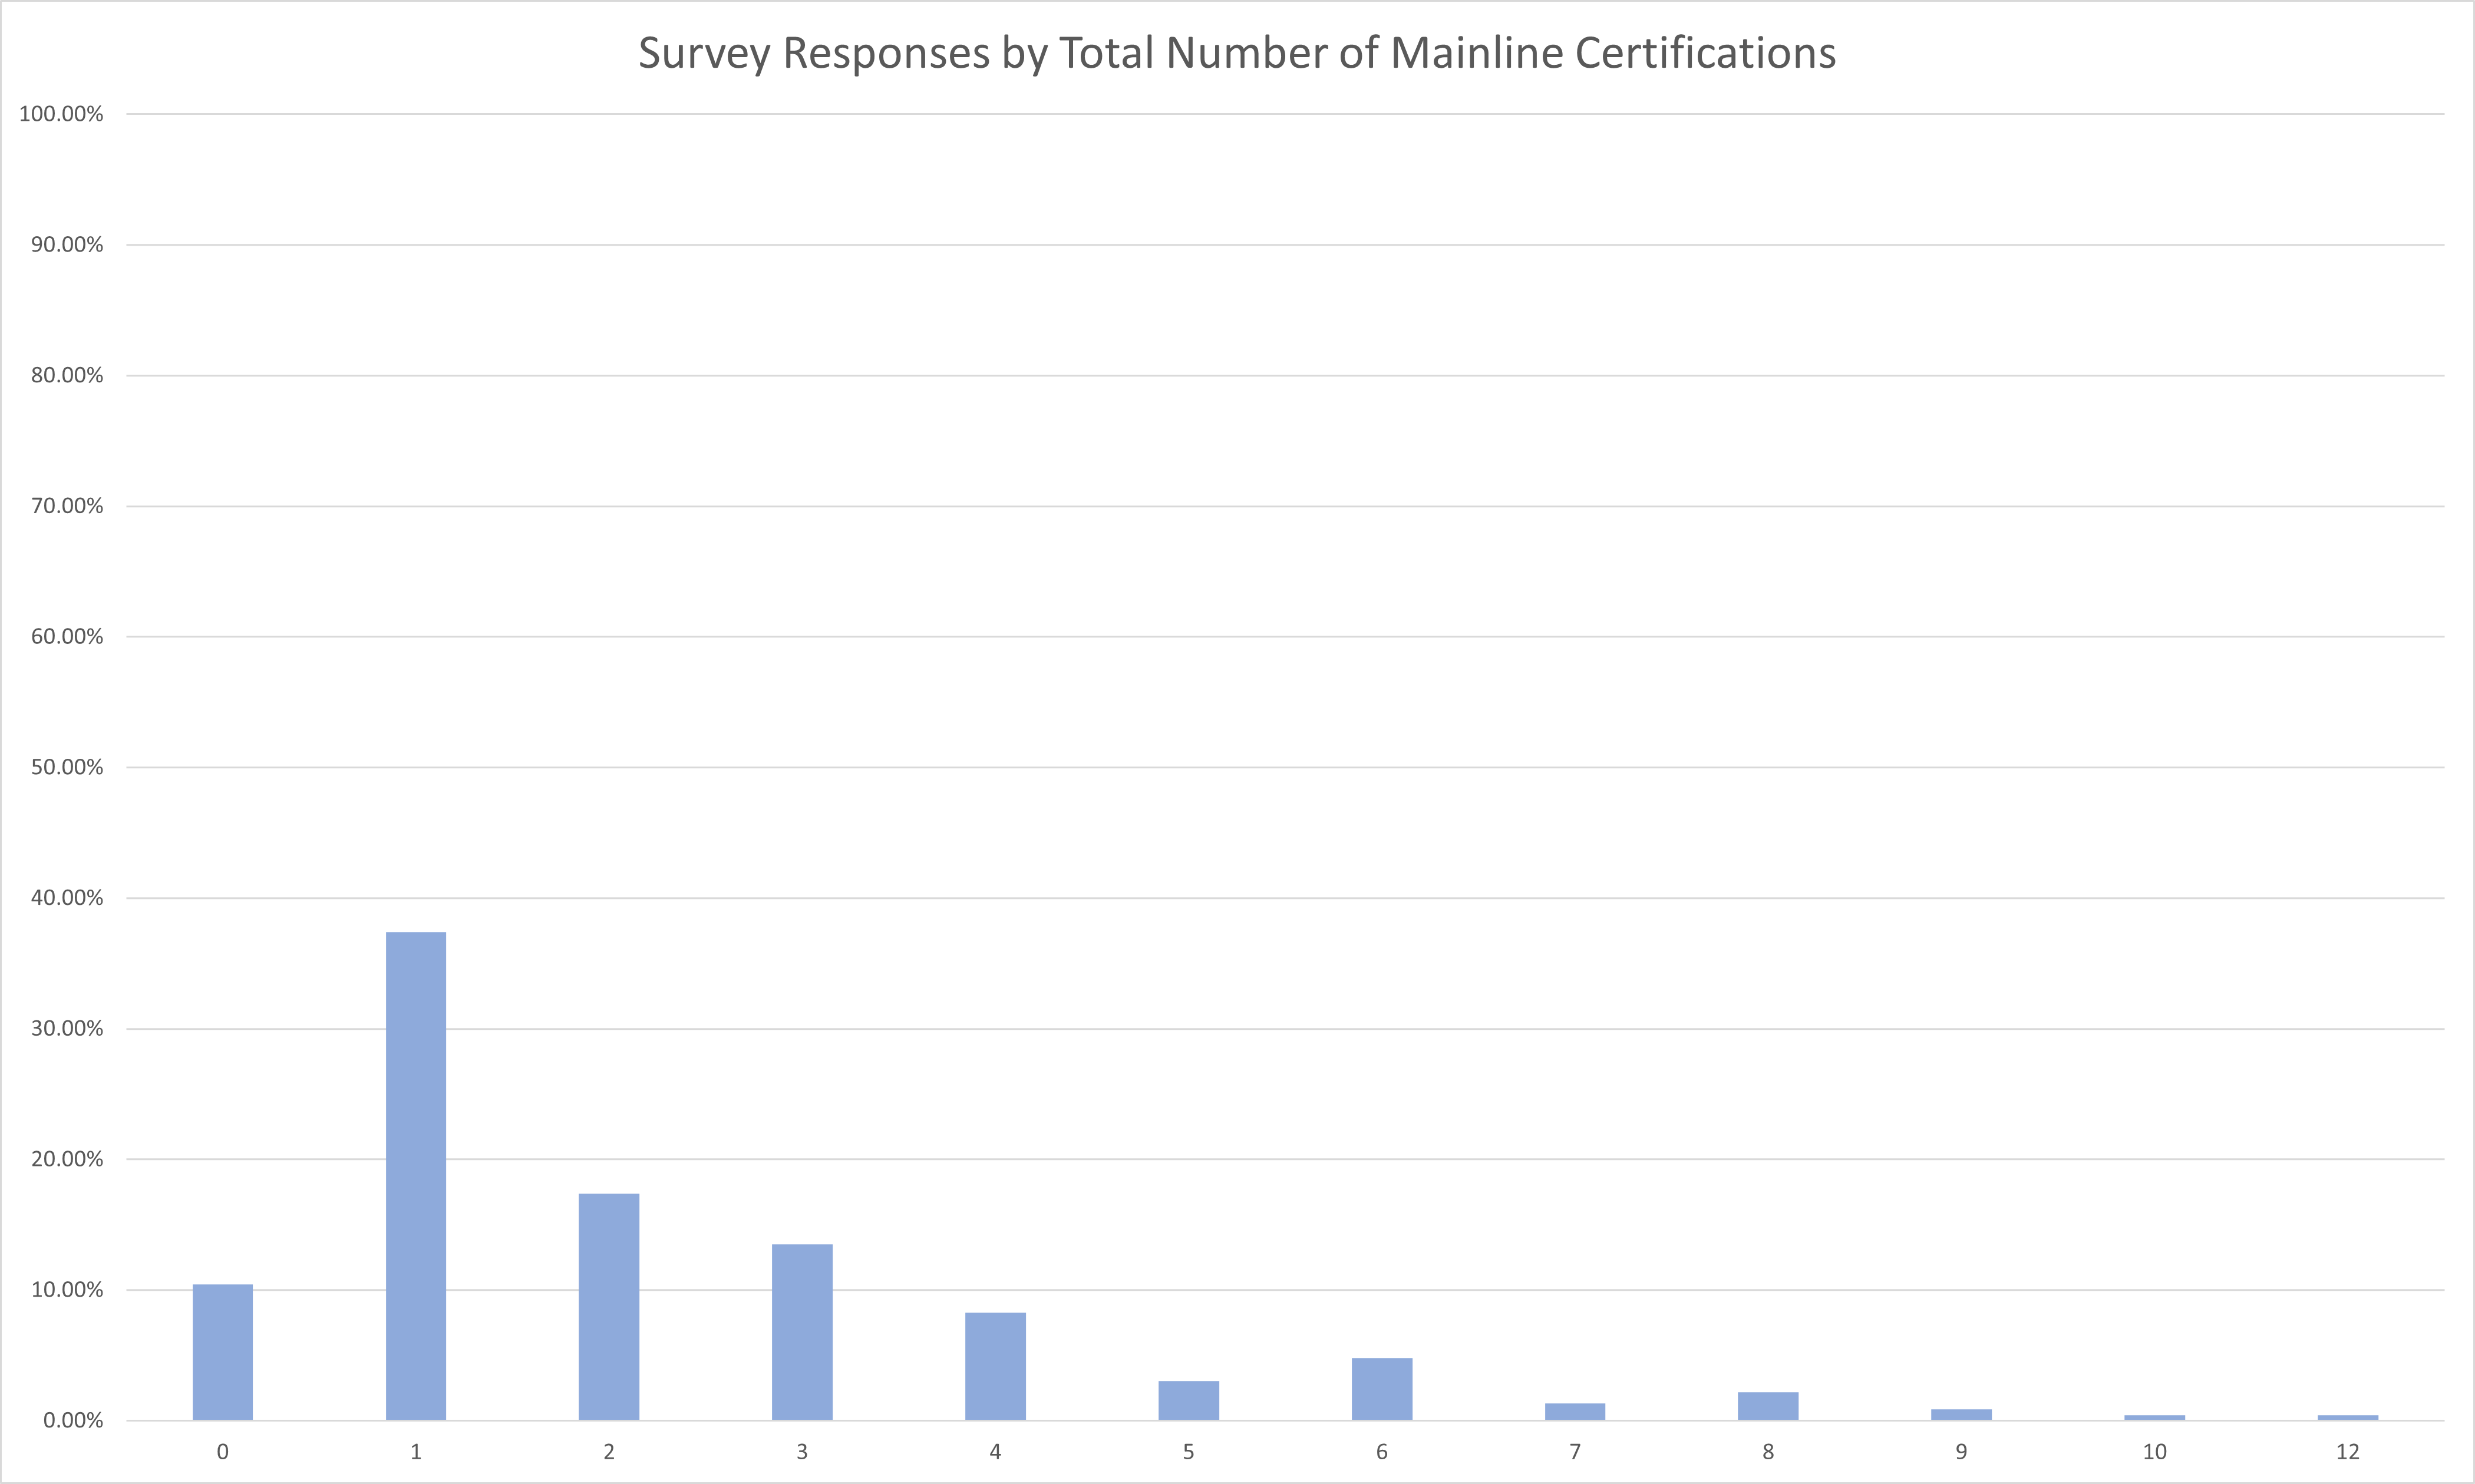
Survey Responses by Total Number of Mainline Certifications
The results of this question were inferred from responses to:
Survey Responses by Total Number of Mainline Certifications
Response
Percent of Respondents
0
10.43%
1
37.39%
2
17.39%
3
13.48%
4
8.26%
5
3.04%
6
4.78%
7
1.30%
8
2.17%
9
0.87%
10
0.43%
12
0.43%
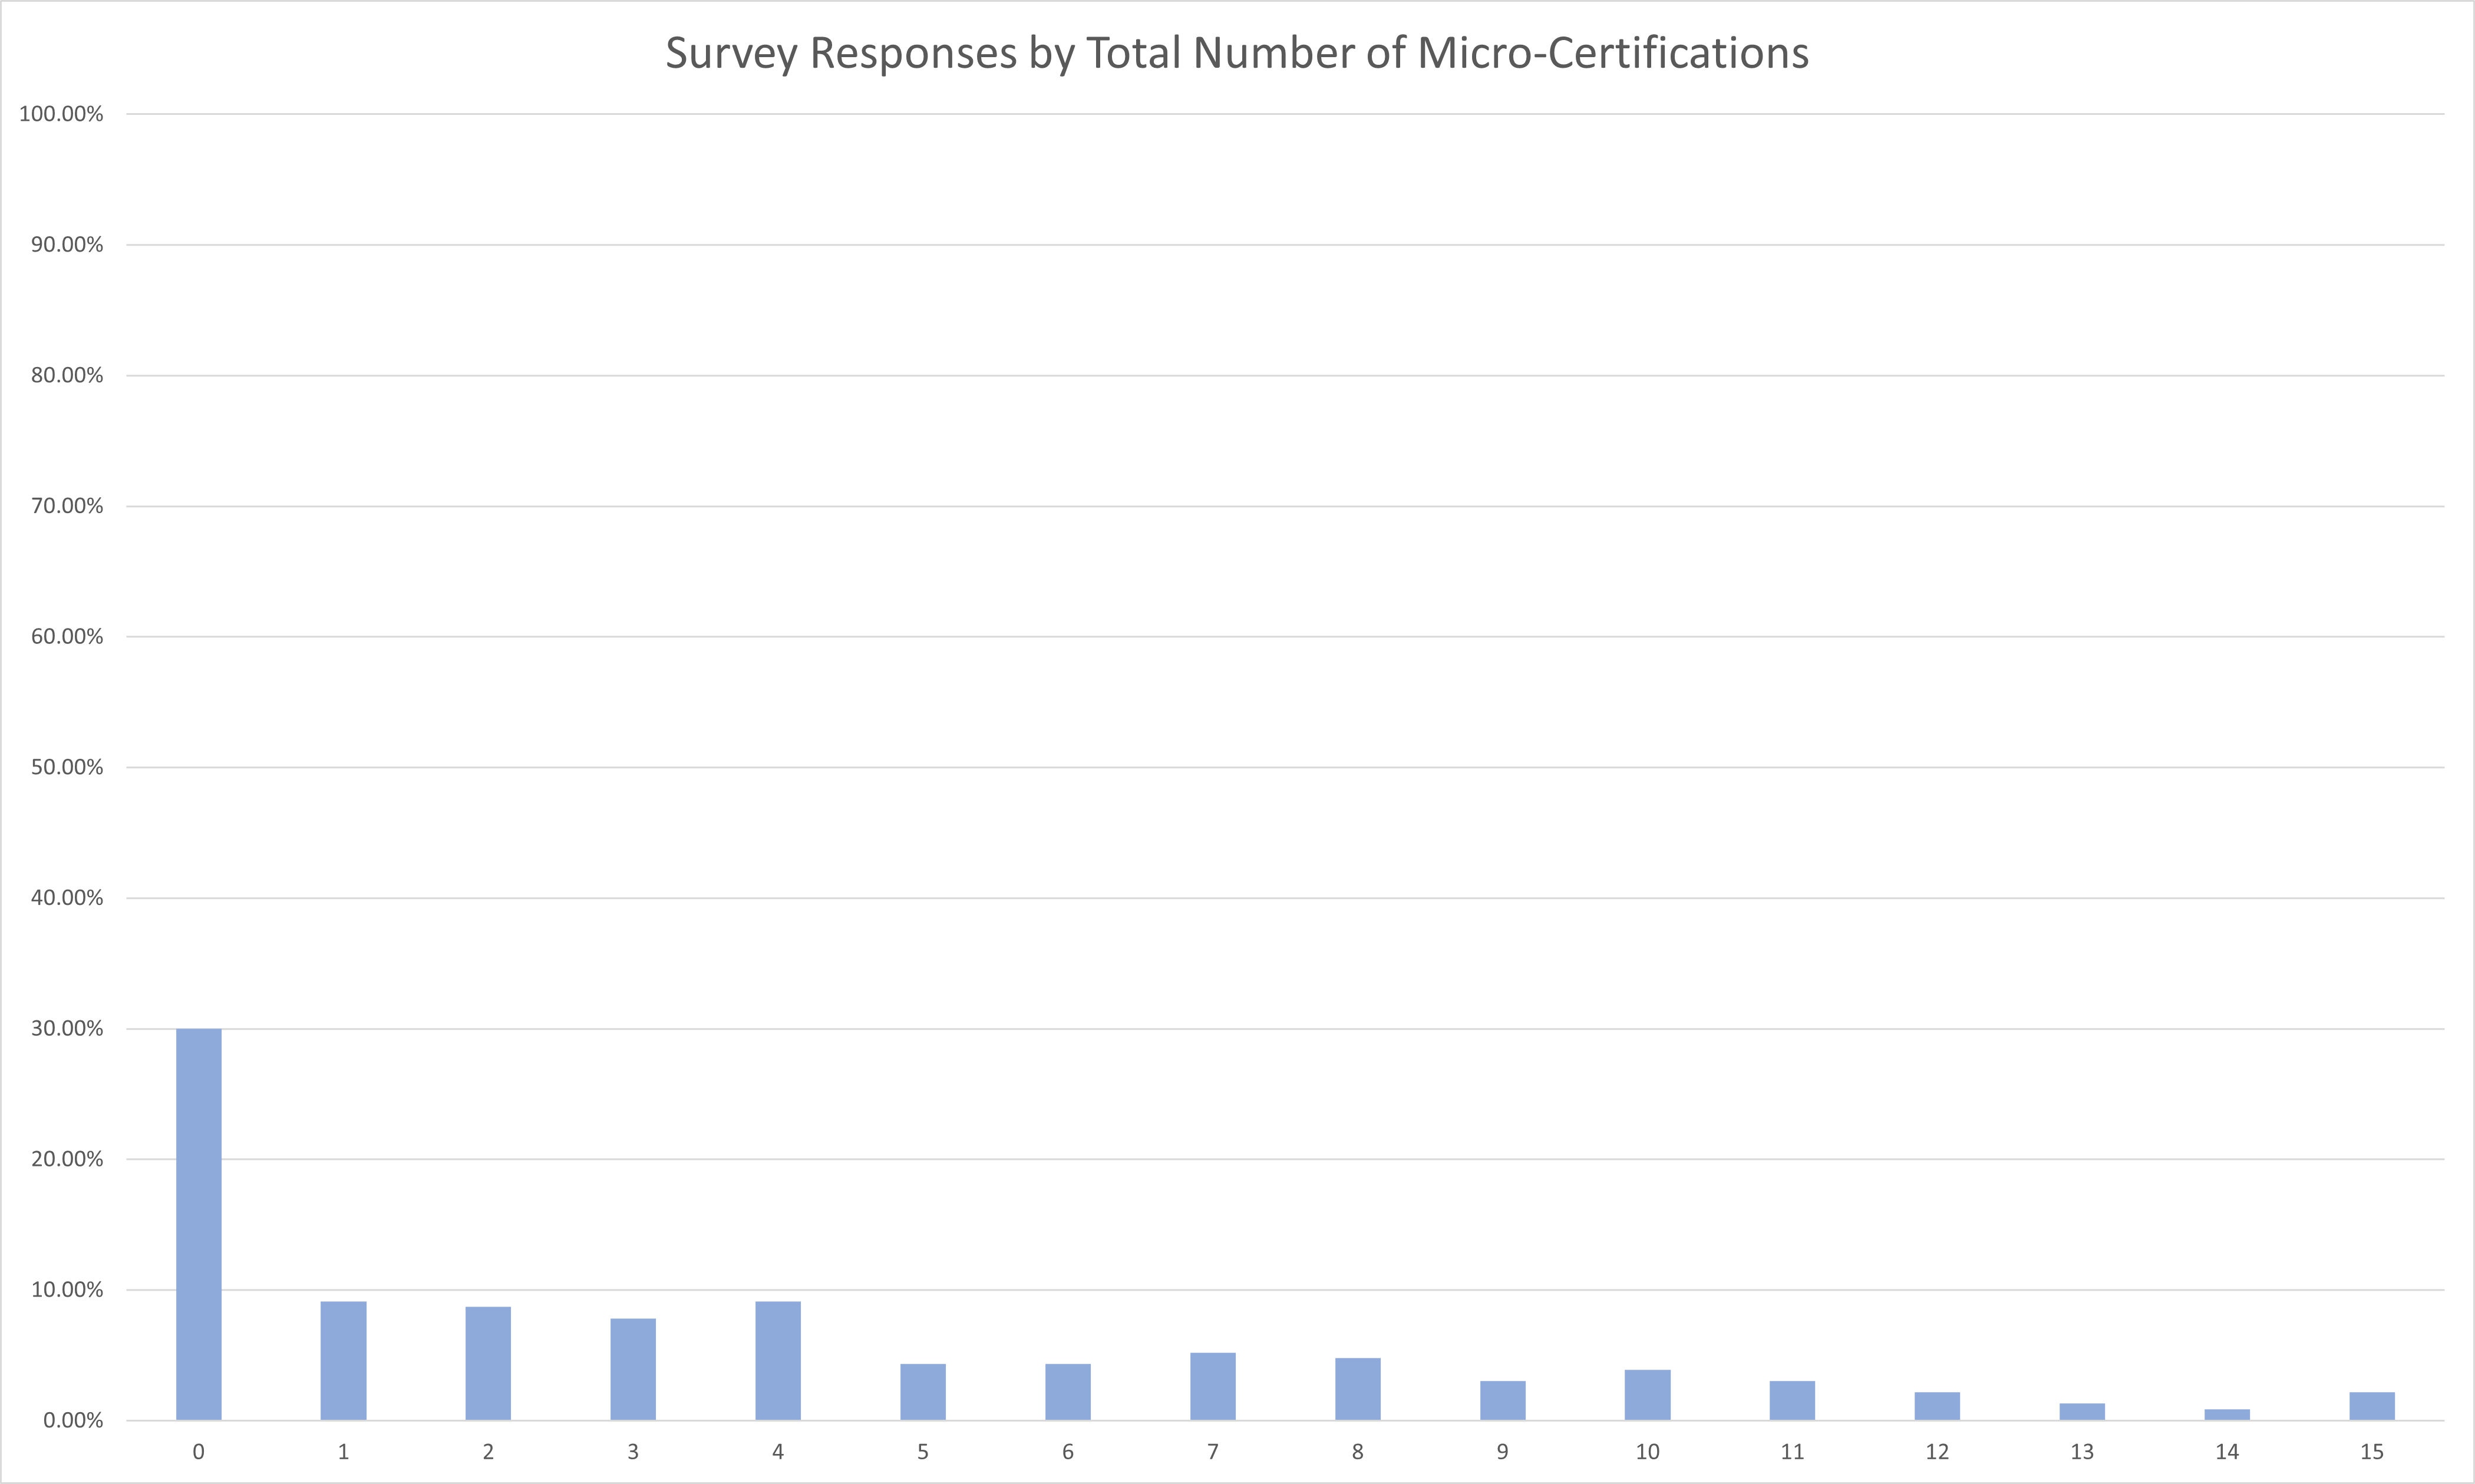
Survey Responses by Total Number of Micro-Certifications
The results of this question were inferred from responses to:
Survey Responses by Total Number of Micro-Certifications
Response
Percent of Respondents
0
30.00%
1
9.13%
2
8.70%
3
7.83%
4
9.13%
5
4.35%
6
4.35%
7
5.22%
8
4.78%
9
3.04%
10
3.91%
11
3.04%
12
2.17%
13
1.30%
14
0.87%
15
2.17%
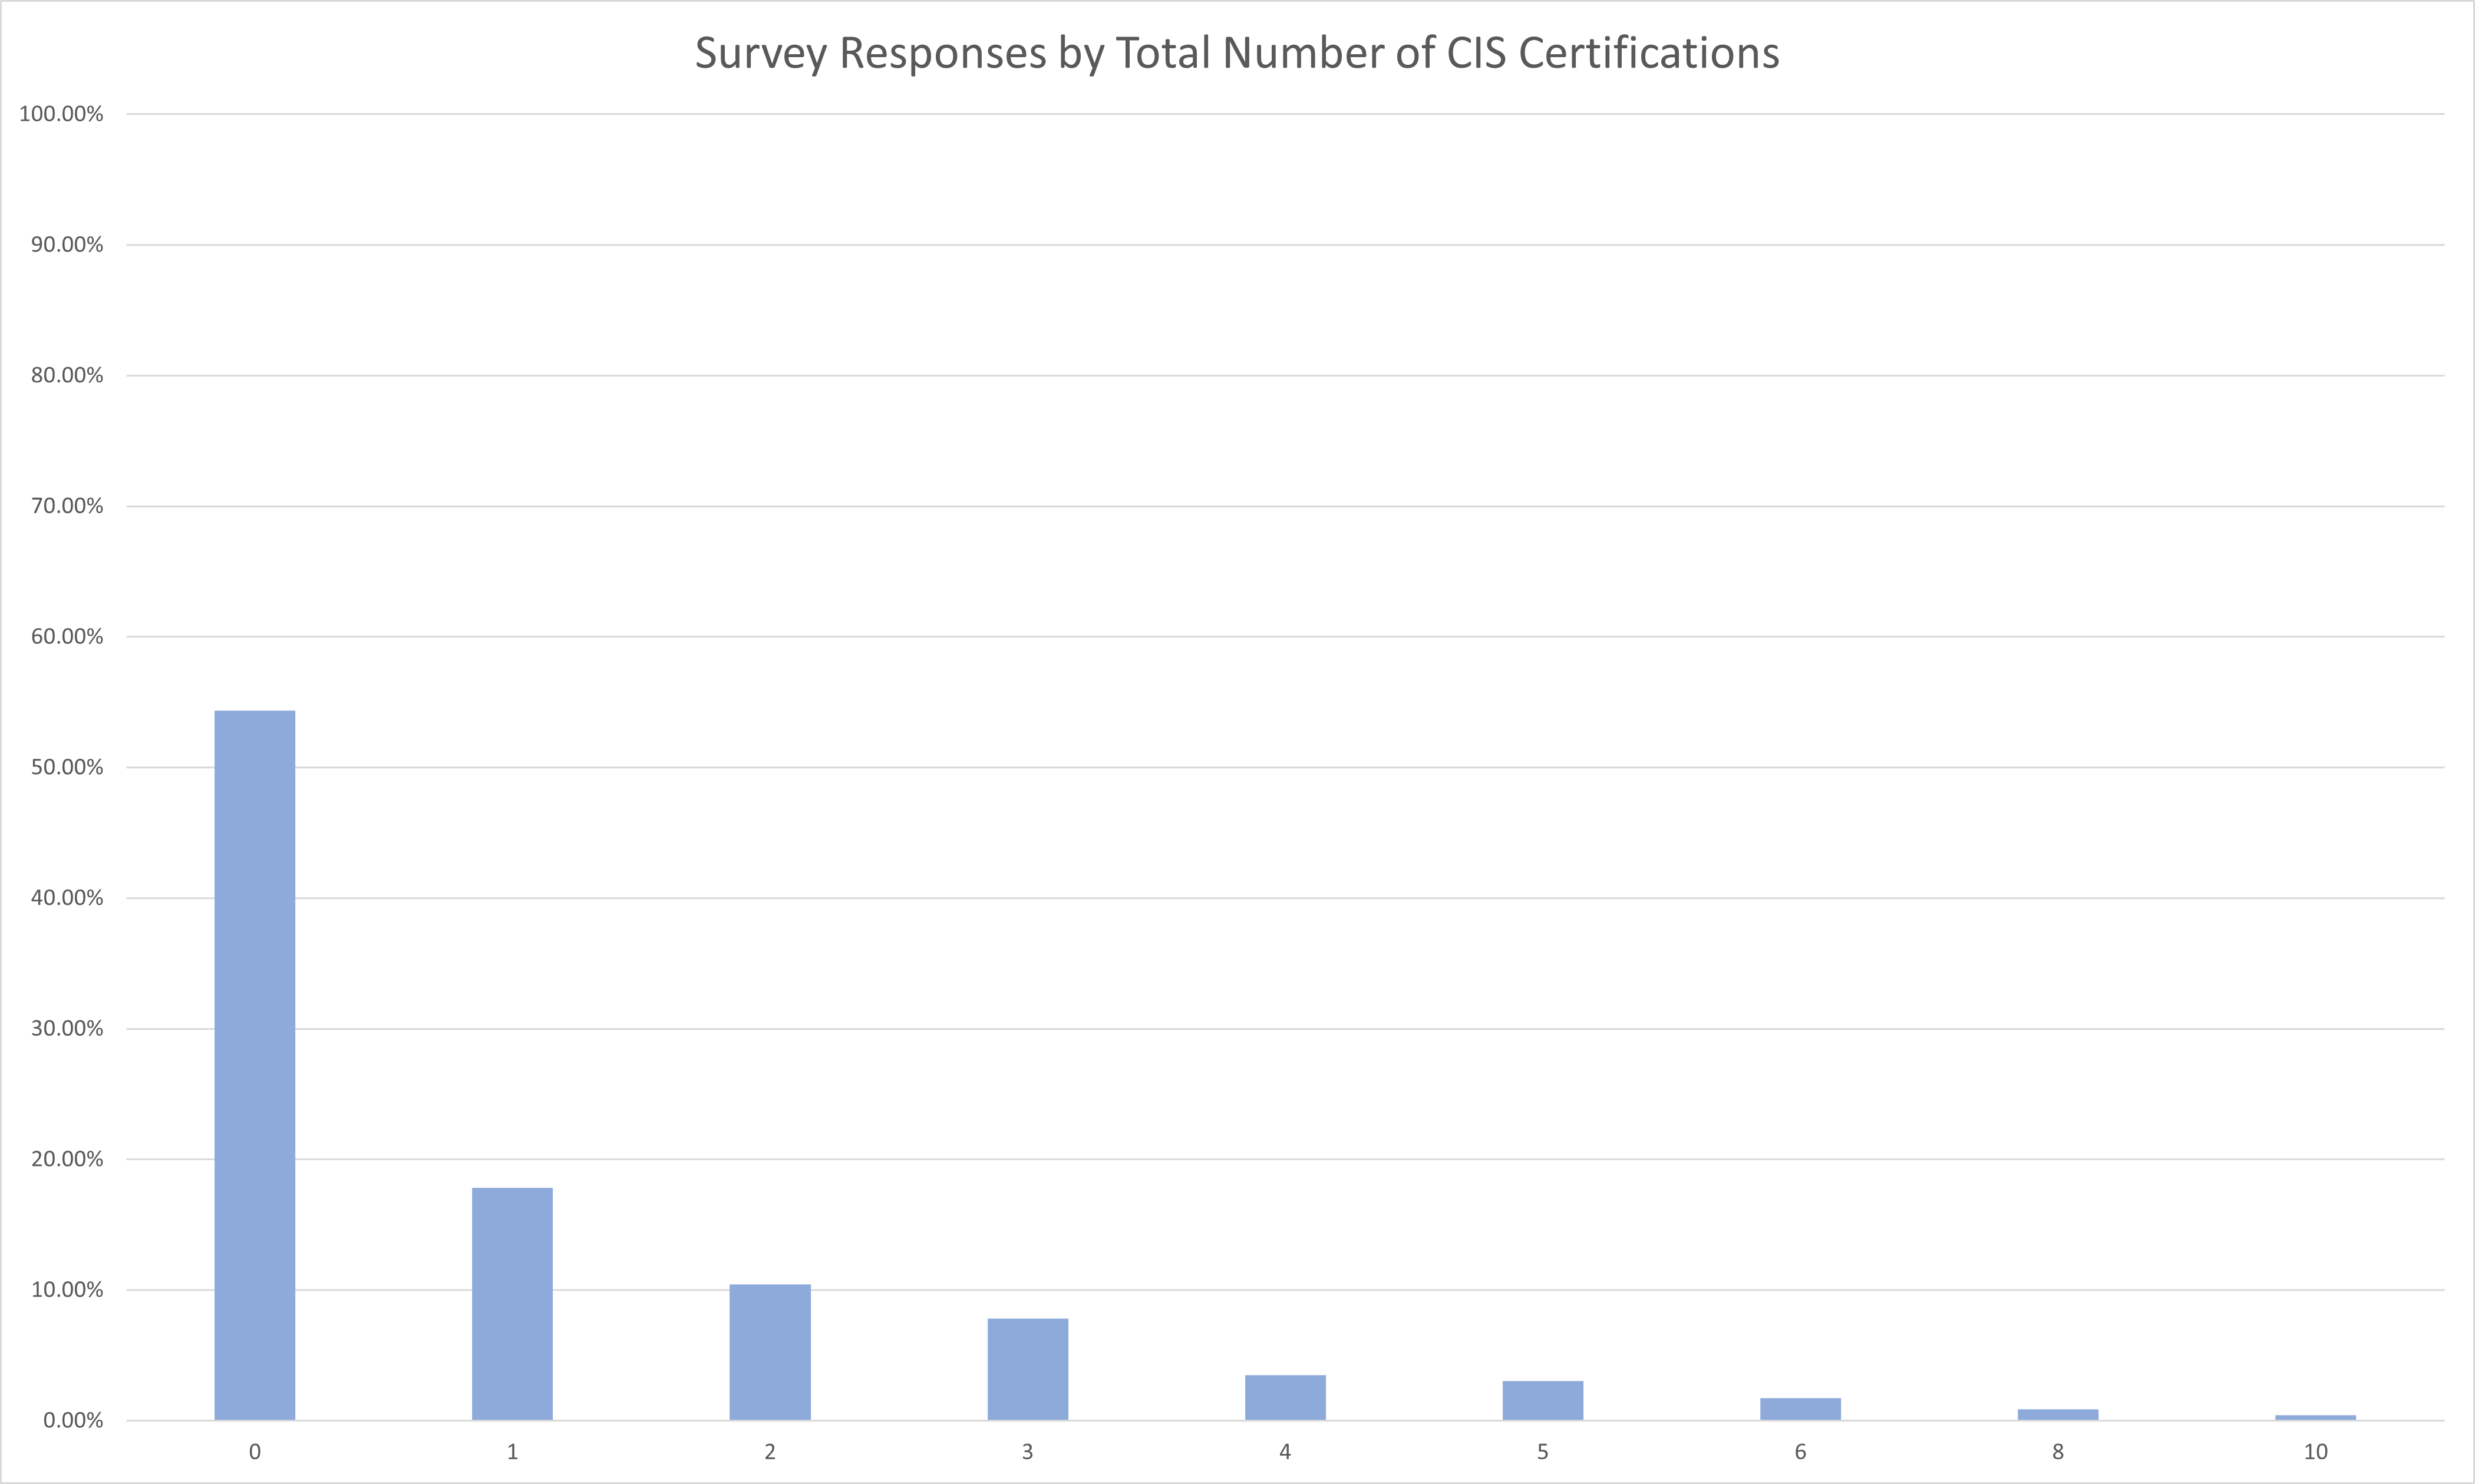
Survey Responses by Total Number of CIS Certifications
The results of this question were inferred from responses to:
Survey Responses by Total Number of CIS Certifications
Response
Percent of Respondents
0
54.35%
1
17.83%
2
10.43%
3
7.83%
4
3.48%
5
3.04%
6
1.74%
8
0.87%
10
0.43%
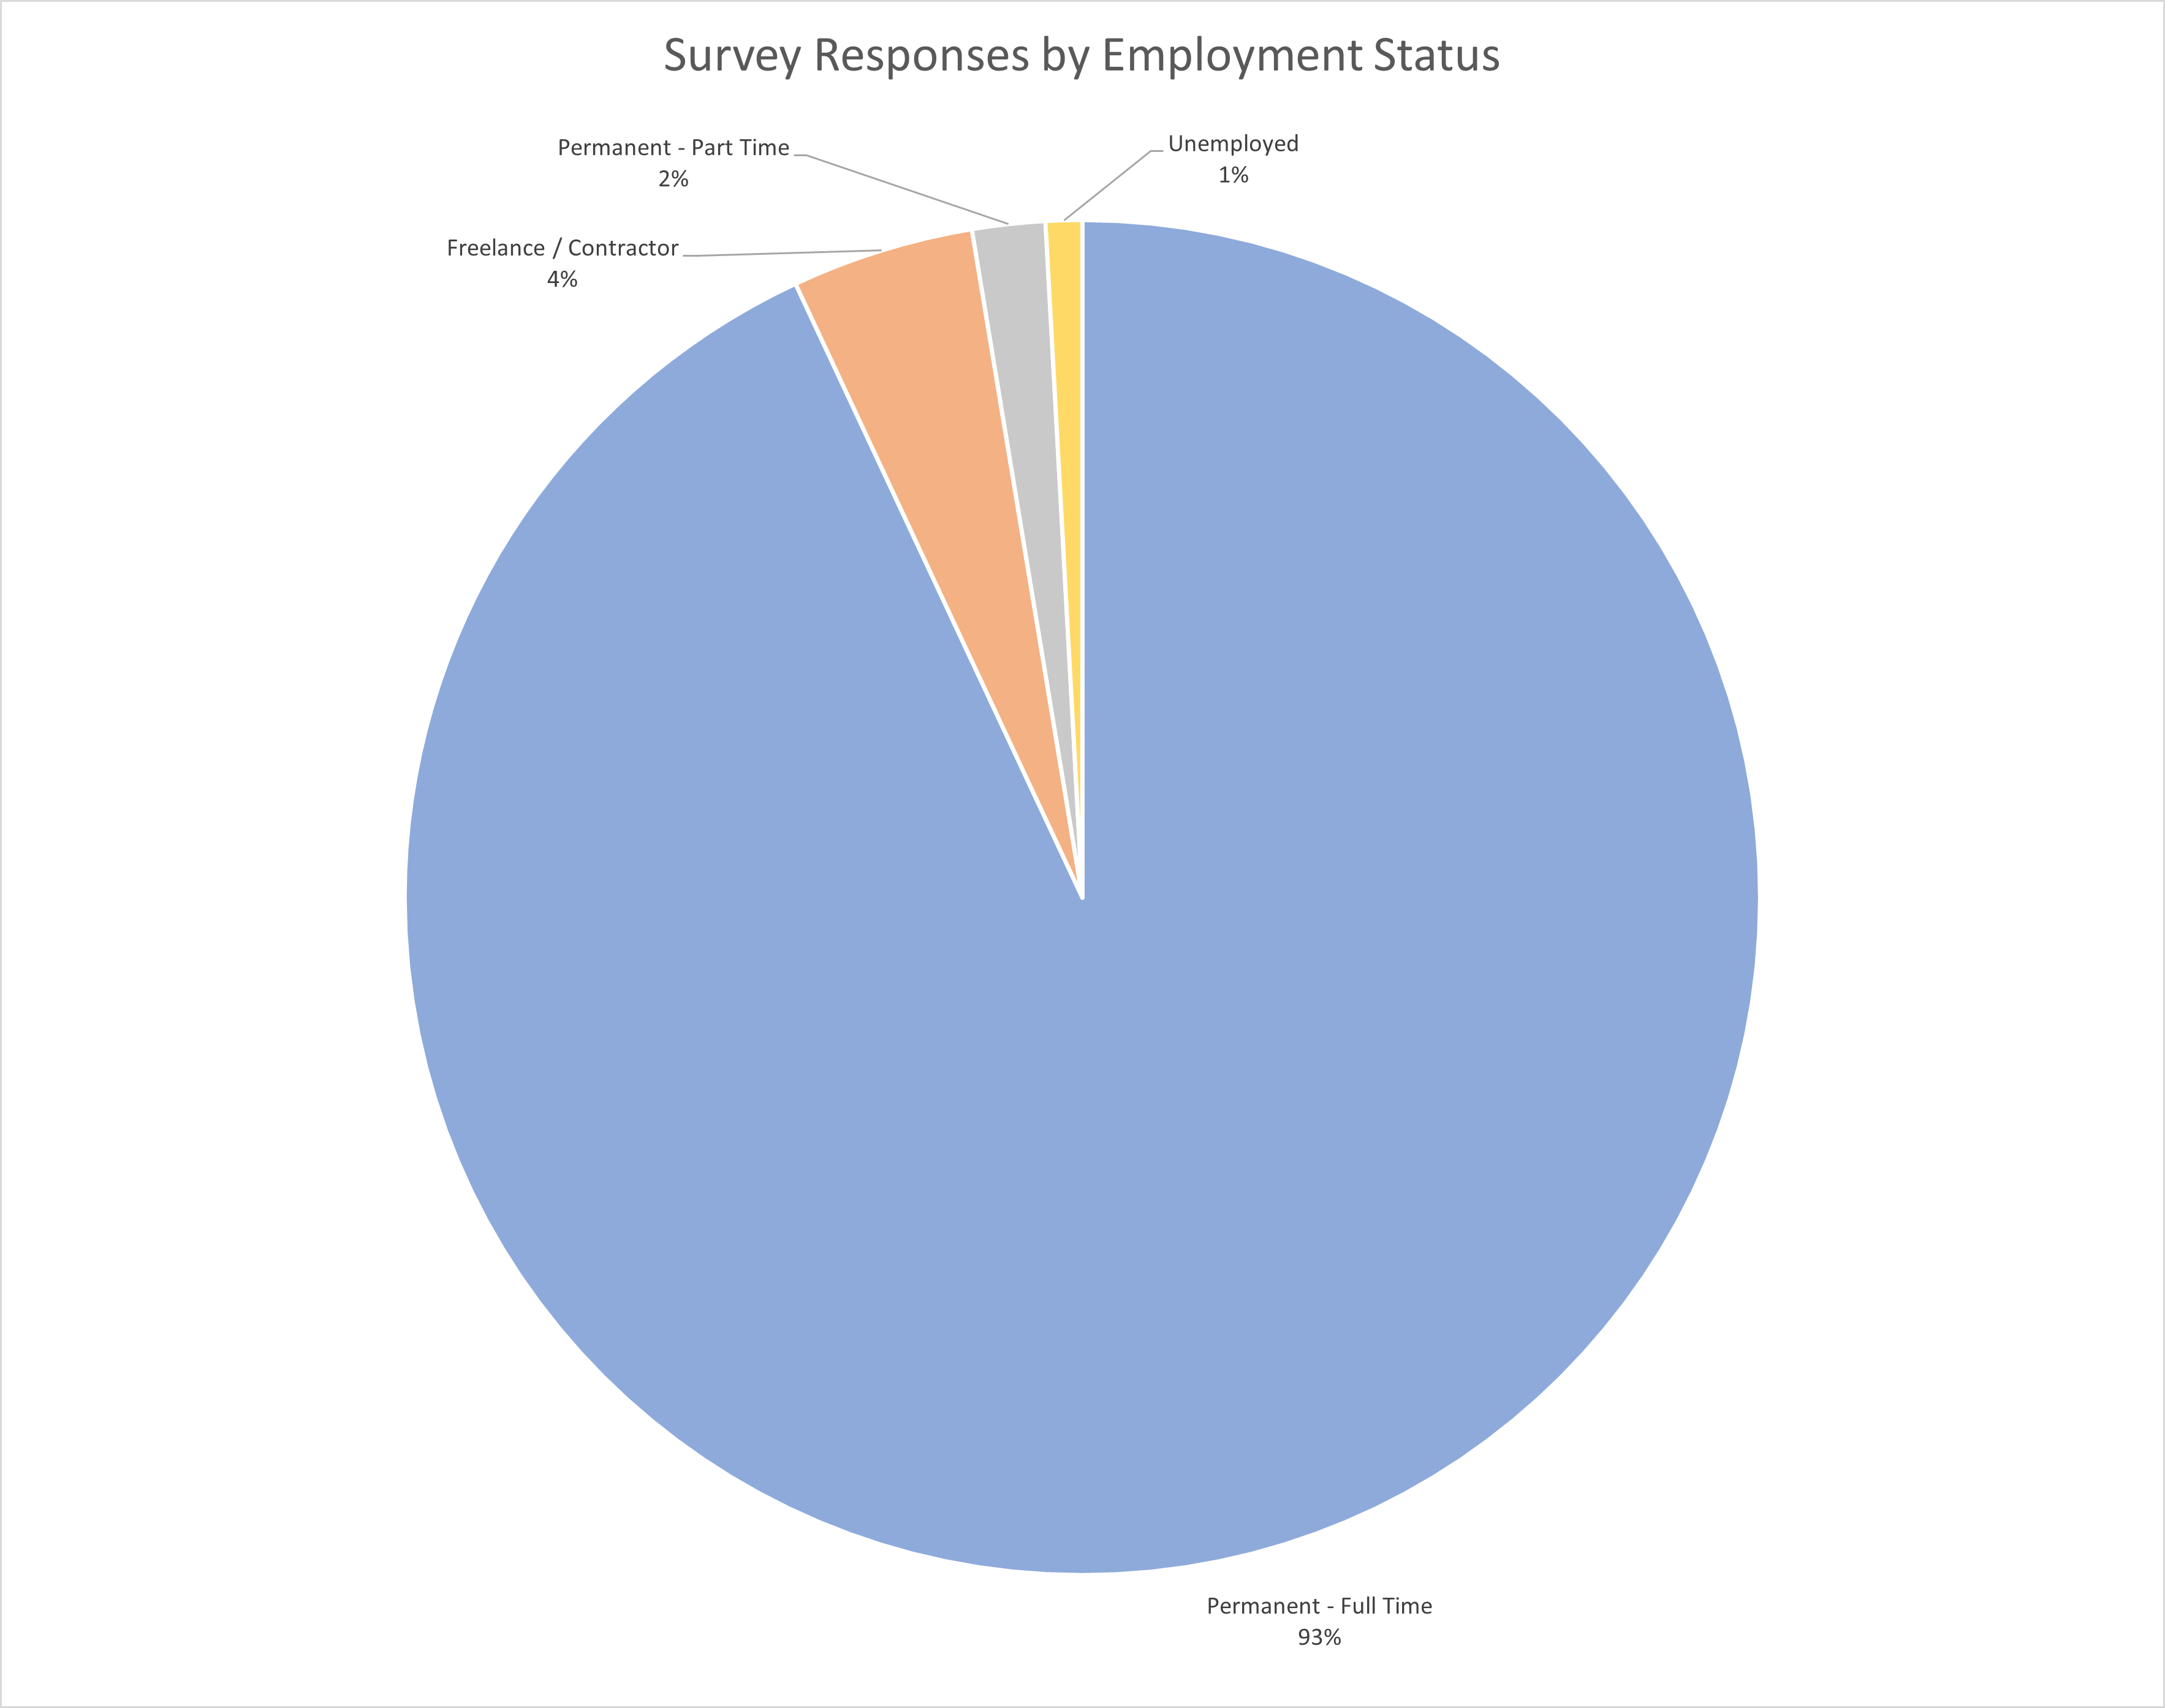
What is your current employment status?
Survey Responses by Employment Status
Response
Percent of Respondents
Permanent - Full Time
93.04%
Freelance / Contractor
4.35%
Permanent - Part Time
1.74%
Unemployed
0.87%
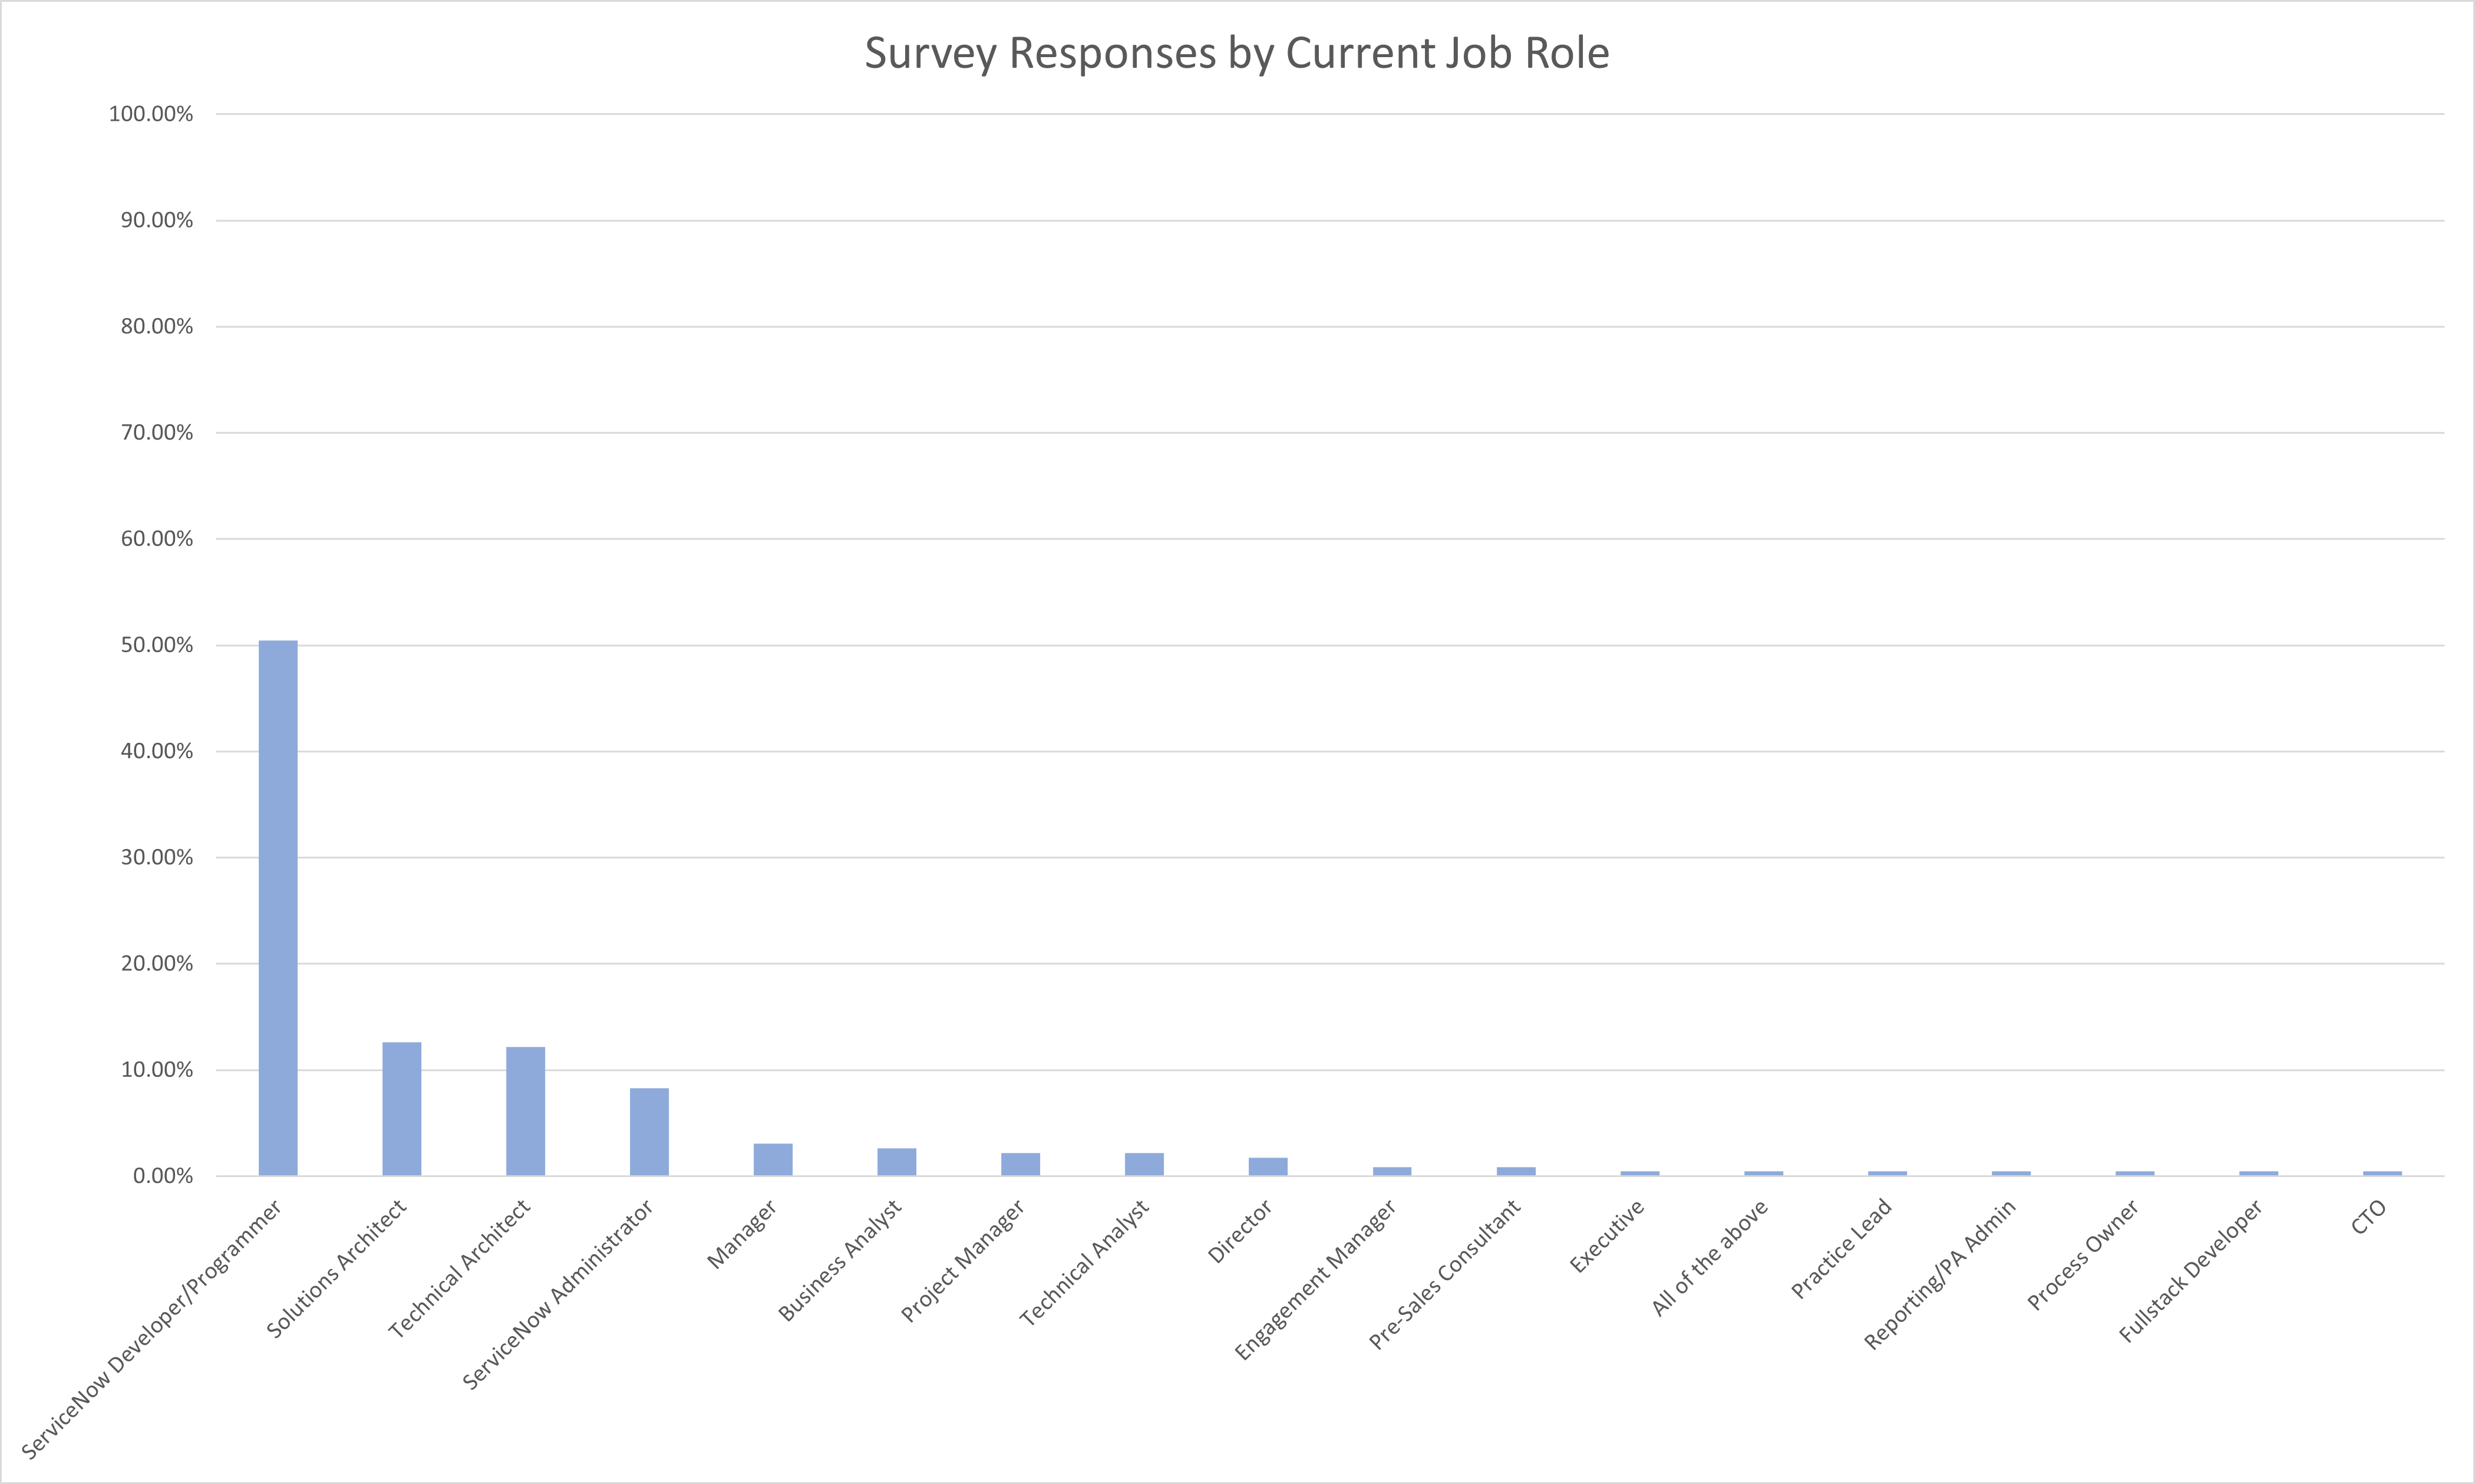
Which of the following best describes your current job role?
Survey Responses by Current Job Role
Response
Percent of Respondents
ServiceNow Developer/Programmer
50.43%
Solutions Architect
12.61%
Technical Architect
12.17%
ServiceNow Administrator
8.26%
Manager
3.04%
Business Analyst
2.61%
Project Manager
2.17%
Technical Analyst
2.17%
Director
1.74%
Engagement Manager
0.87%
Pre-Sales Consultant
0.87%
Executive
0.43%
All of the above
0.43%
Practice Lead
0.43%
Reporting/PA Admin
0.43%
Process Owner
0.43%
Fullstack Developer
0.43%
CTO
0.43%
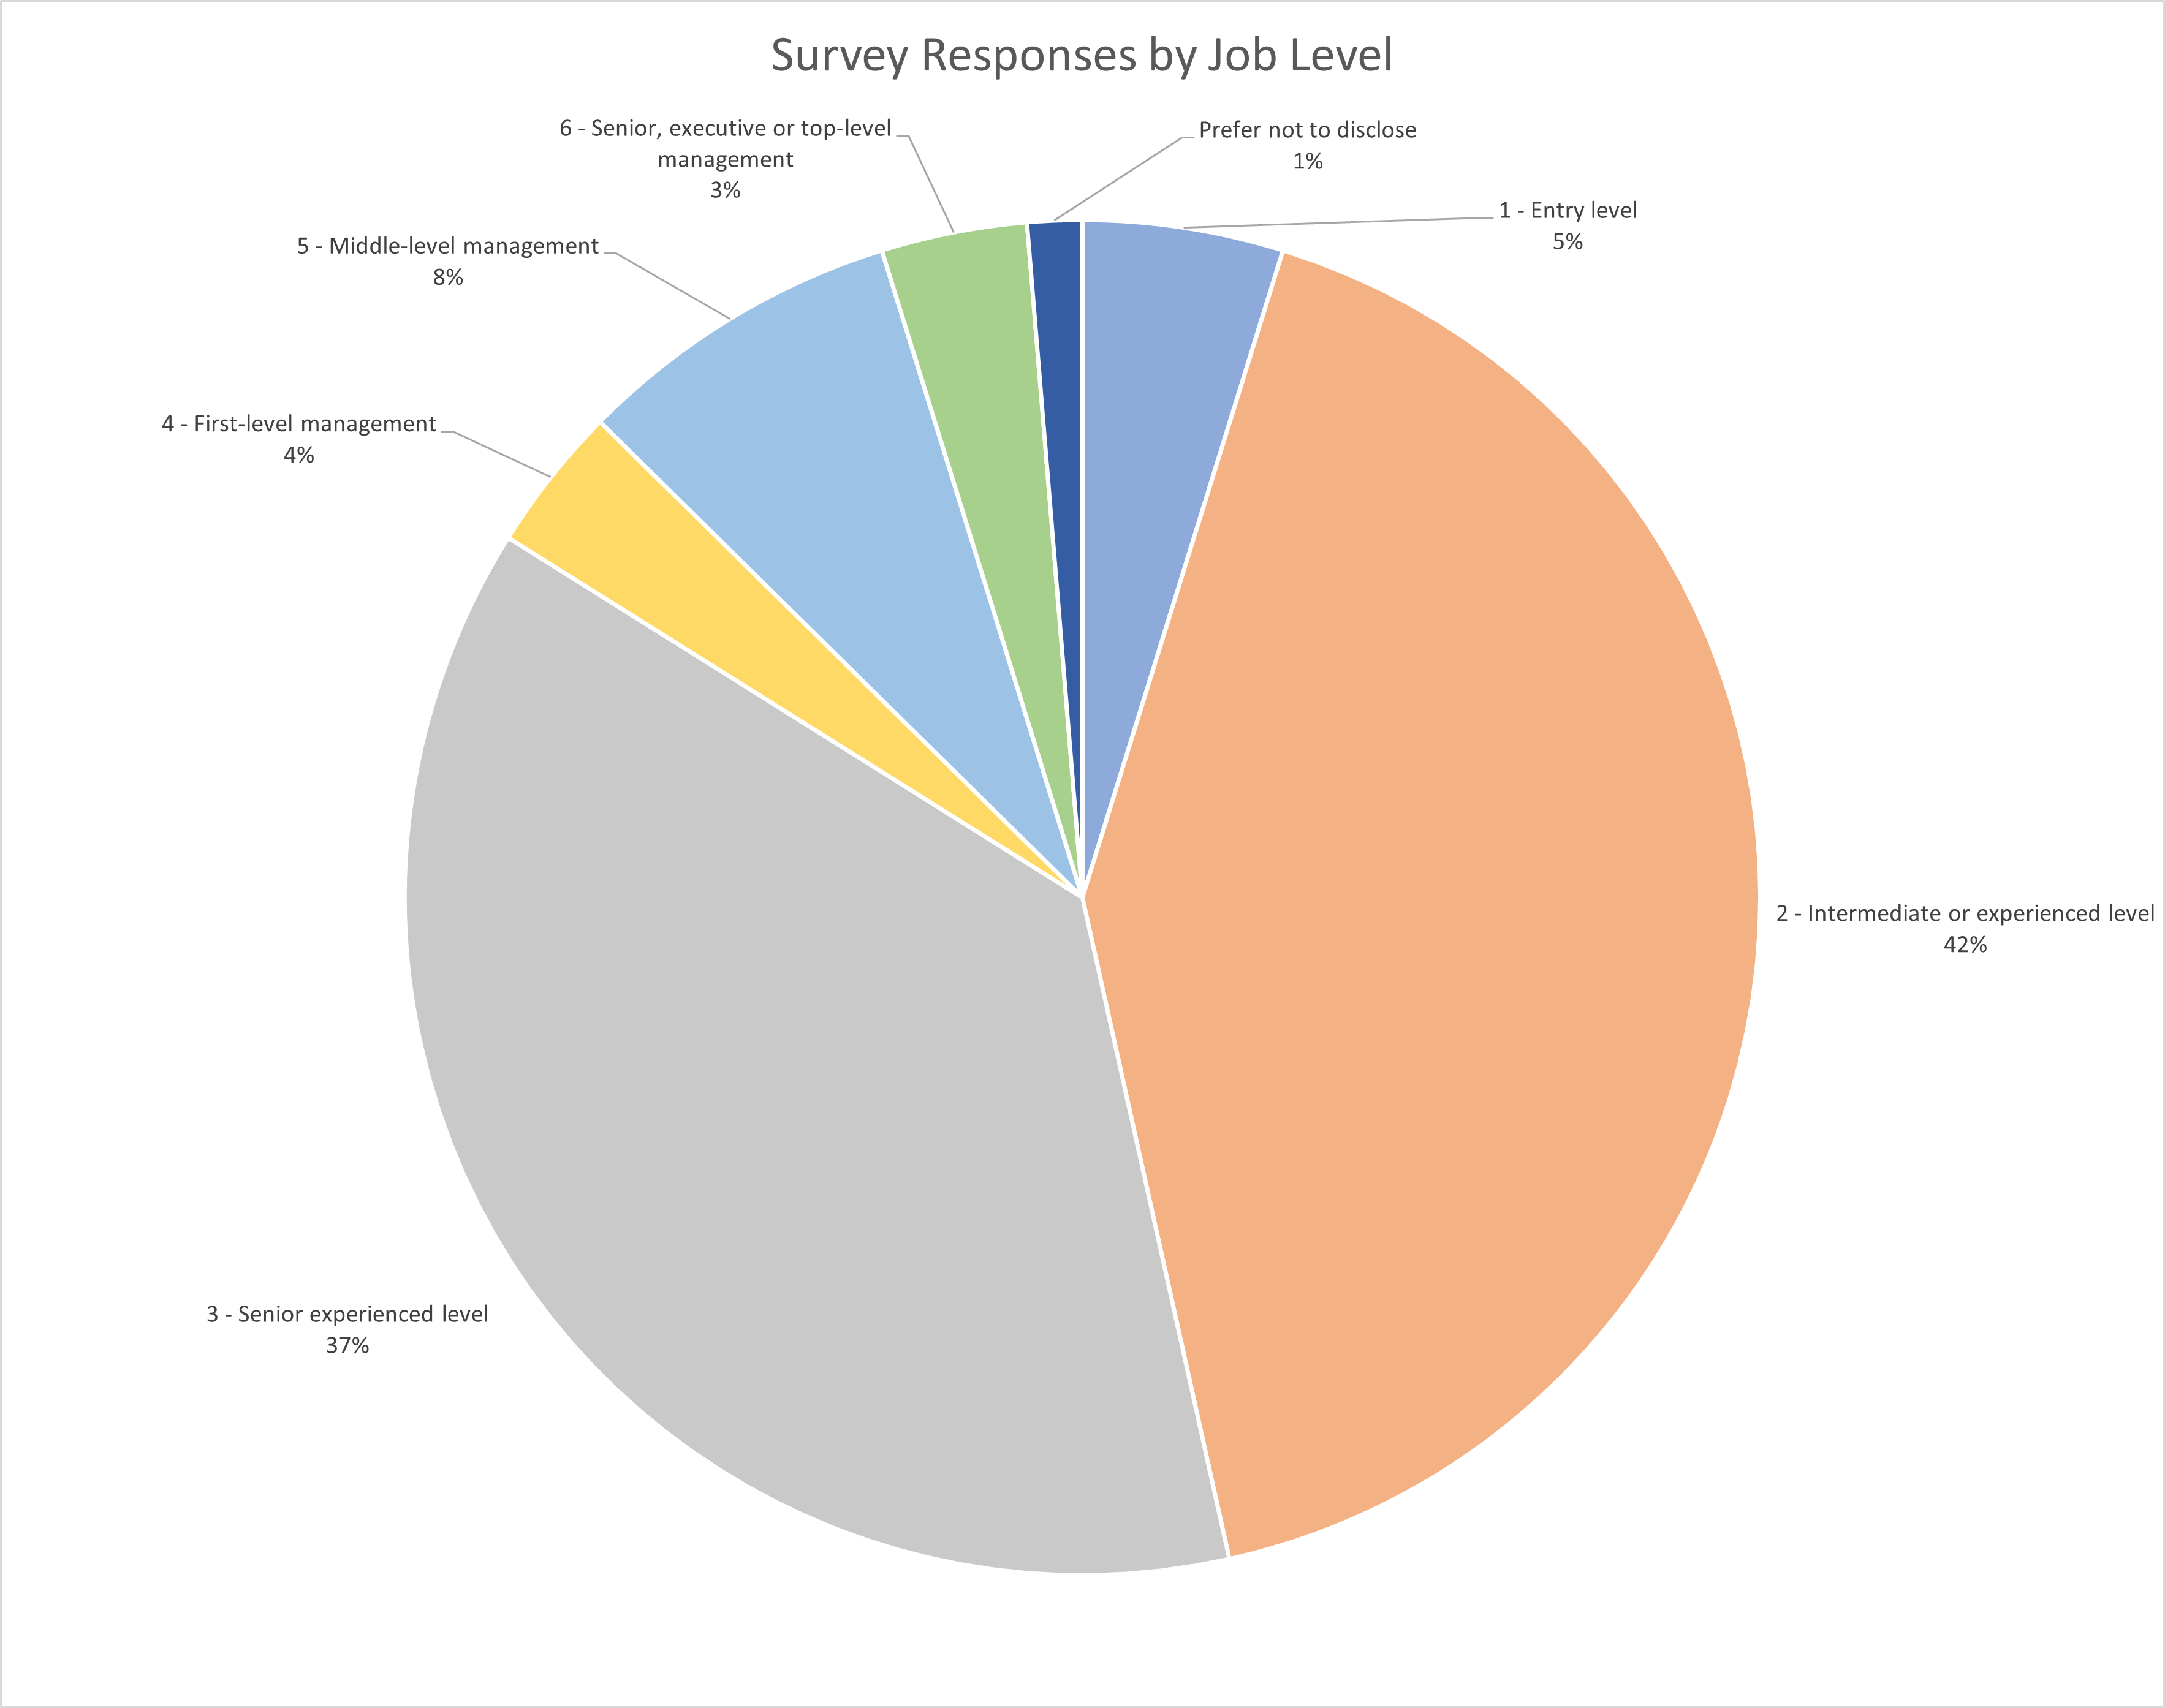
Which of the following best describes your job level?
Survey Responses by Current Job Level
Response
Percent of Respondents
1 - Entry level
4.78%
2 - Intermediate or experienced level
41.74%
3 - Senior experienced level
37.39%
4 - First-level management
3.48%
5 - Middle-level management
7.83%
6 - Senior, executive or top-level management
3.48%
Prefer not to disclose
1.30%
What percent of the time do you typically spend working remotely (before the COVID-19 Pandemic)?
Survey Responses by Percent Remote Work
Response
Percent of Respondents
0
15.22%
2
0.87%
4
0.43%
5
3.48%
6
0.43%
8
1.30%
9
1.74%
10
5.65%
13
0.43%
15
0.43%
20
12.17%
30
3.48%
33
0.43%
35
0.87%
40
4.35%
50
4.35%
60
2.61%
70
1.74%
75
0.43%
80
3.04%
90
2.61%
95
0.87%
98
0.43%
99
0.43%
100
30.43%
Prefer not to disclose
1.74%
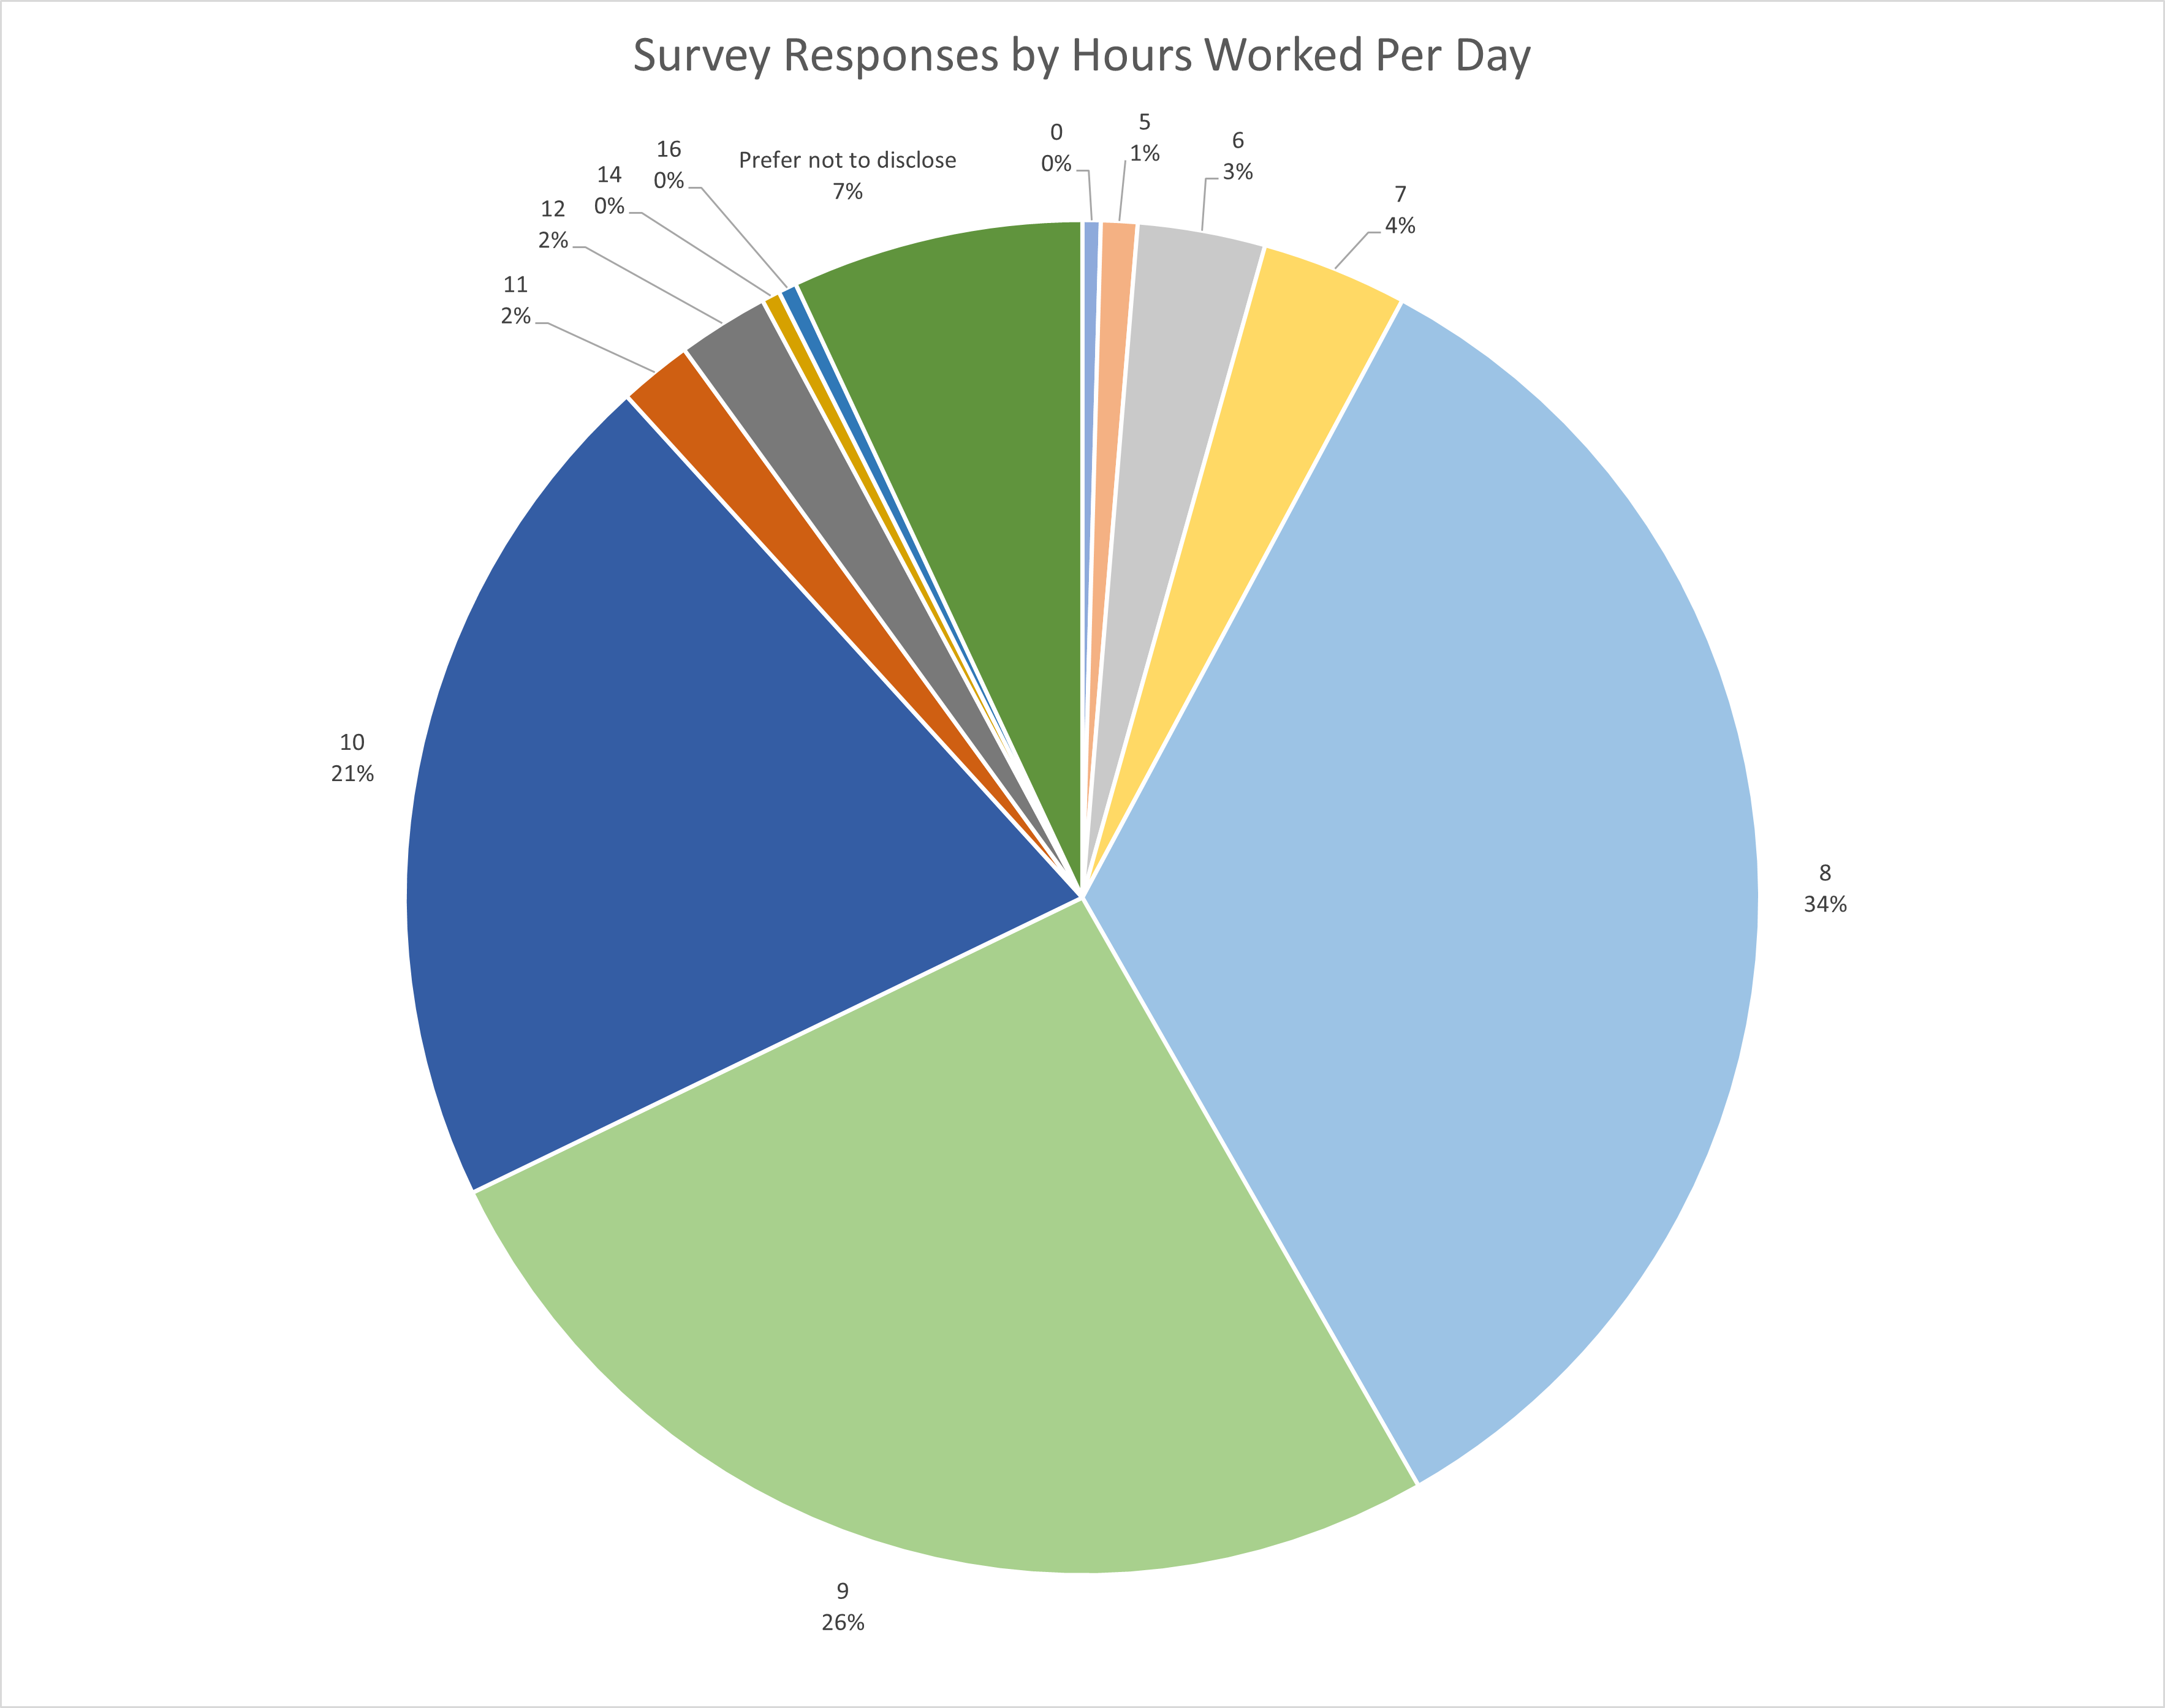
How many hours do you work in a typical work day?
Survey Responses by Percent Remote Work
Response
Percent of Respondents
0
0.43%
5
0.87%
6
3.04%
7
3.48%
8
33.91%
9
26.09%
10
20.43%
11
1.74%
12
2.17%
14
0.43%
16
0.43%
Prefer not to disclose
6.96%
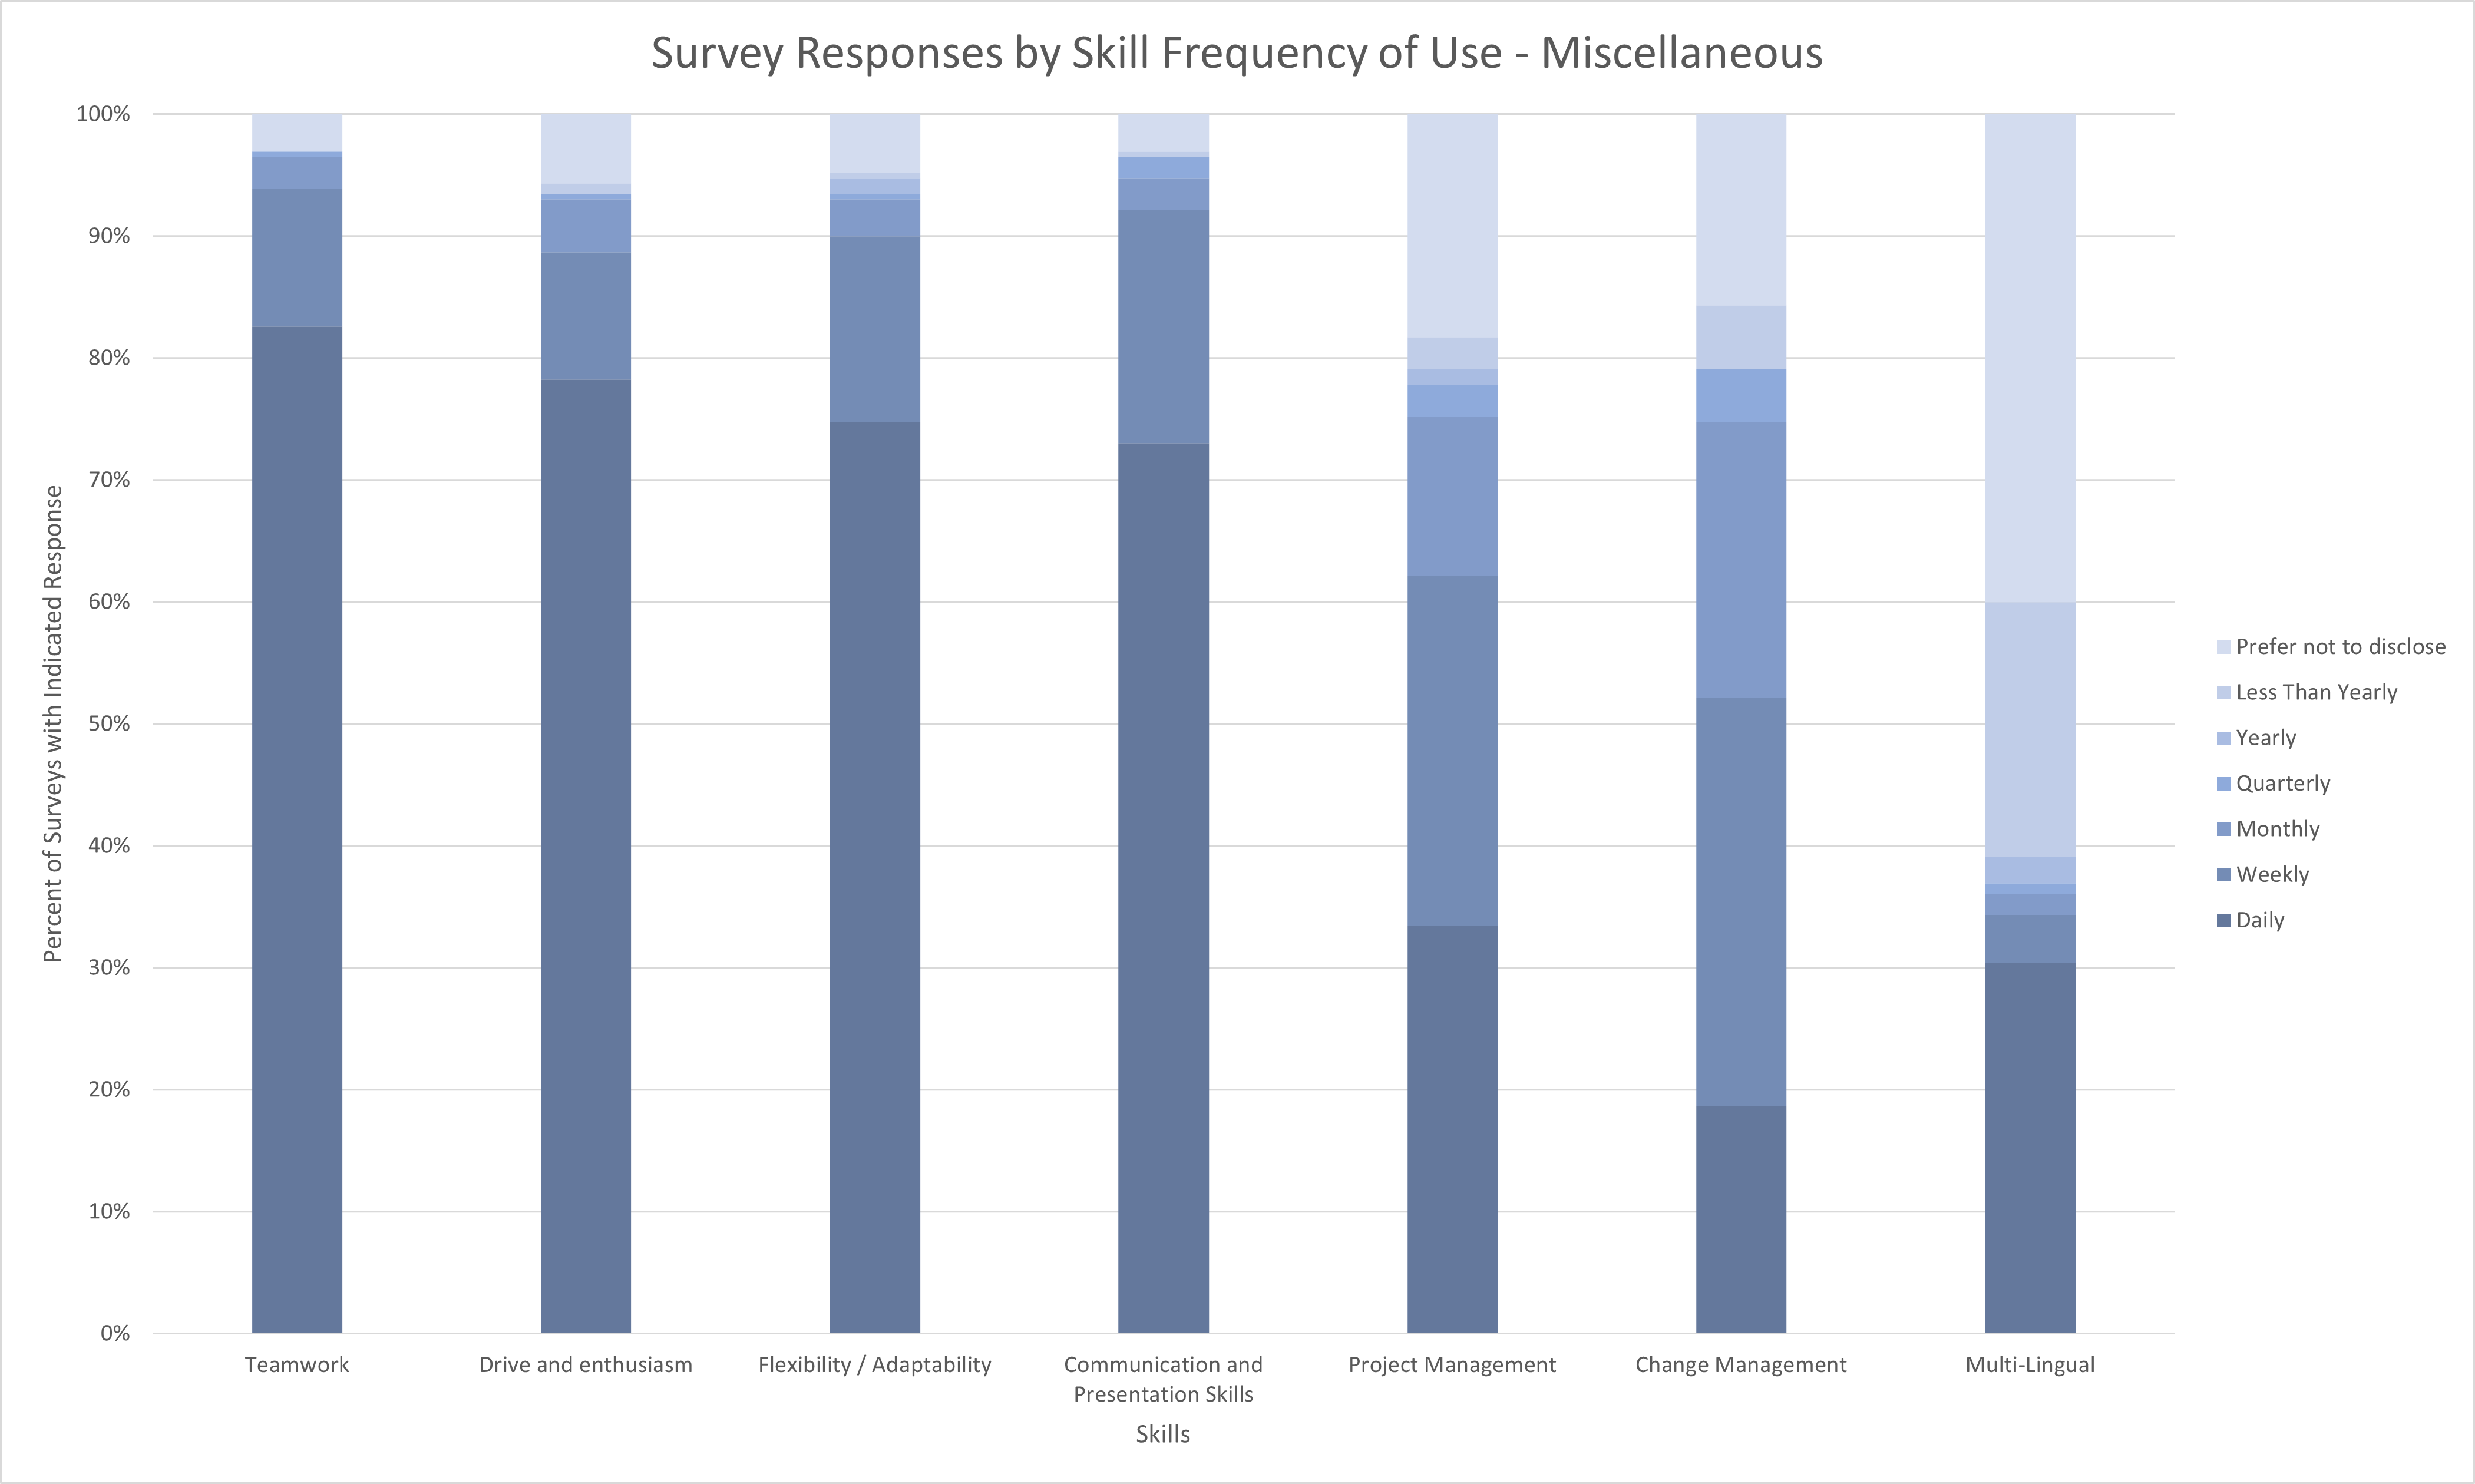
For each of the following skills, please select the highest frequency at which you typically use the skill on the job.
Survey Responses by Skill Frequency of Use - Miscellaneous
Teamwork
Drive and enthusiasm
Flexibility / Adaptability
Communication and Presentation Skills
Project Management
Change Management
Multi-Lingual
Daily
82.61%
78.26%
74.78%
73.04%
33.48%
18.70%
30.43%
Weekly
11.30%
10.43%
15.22%
19.13%
28.70%
33.48%
3.91%
Monthly
2.61%
4.35%
3.04%
2.61%
13.04%
22.61%
1.74%
Quarterly
0.43%
0.43%
0.43%
1.74%
2.61%
4.35%
0.87%
Yearly
0.00%
0.00%
1.30%
0.00%
1.30%
0.00%
2.17%
Less Than Yearly
0.00%
0.87%
0.43%
0.43%
2.61%
5.22%
20.87%
Prefer not to disclose
3.04%
5.65%
4.78%
3.04%
18.26%
15.65%
40.00%
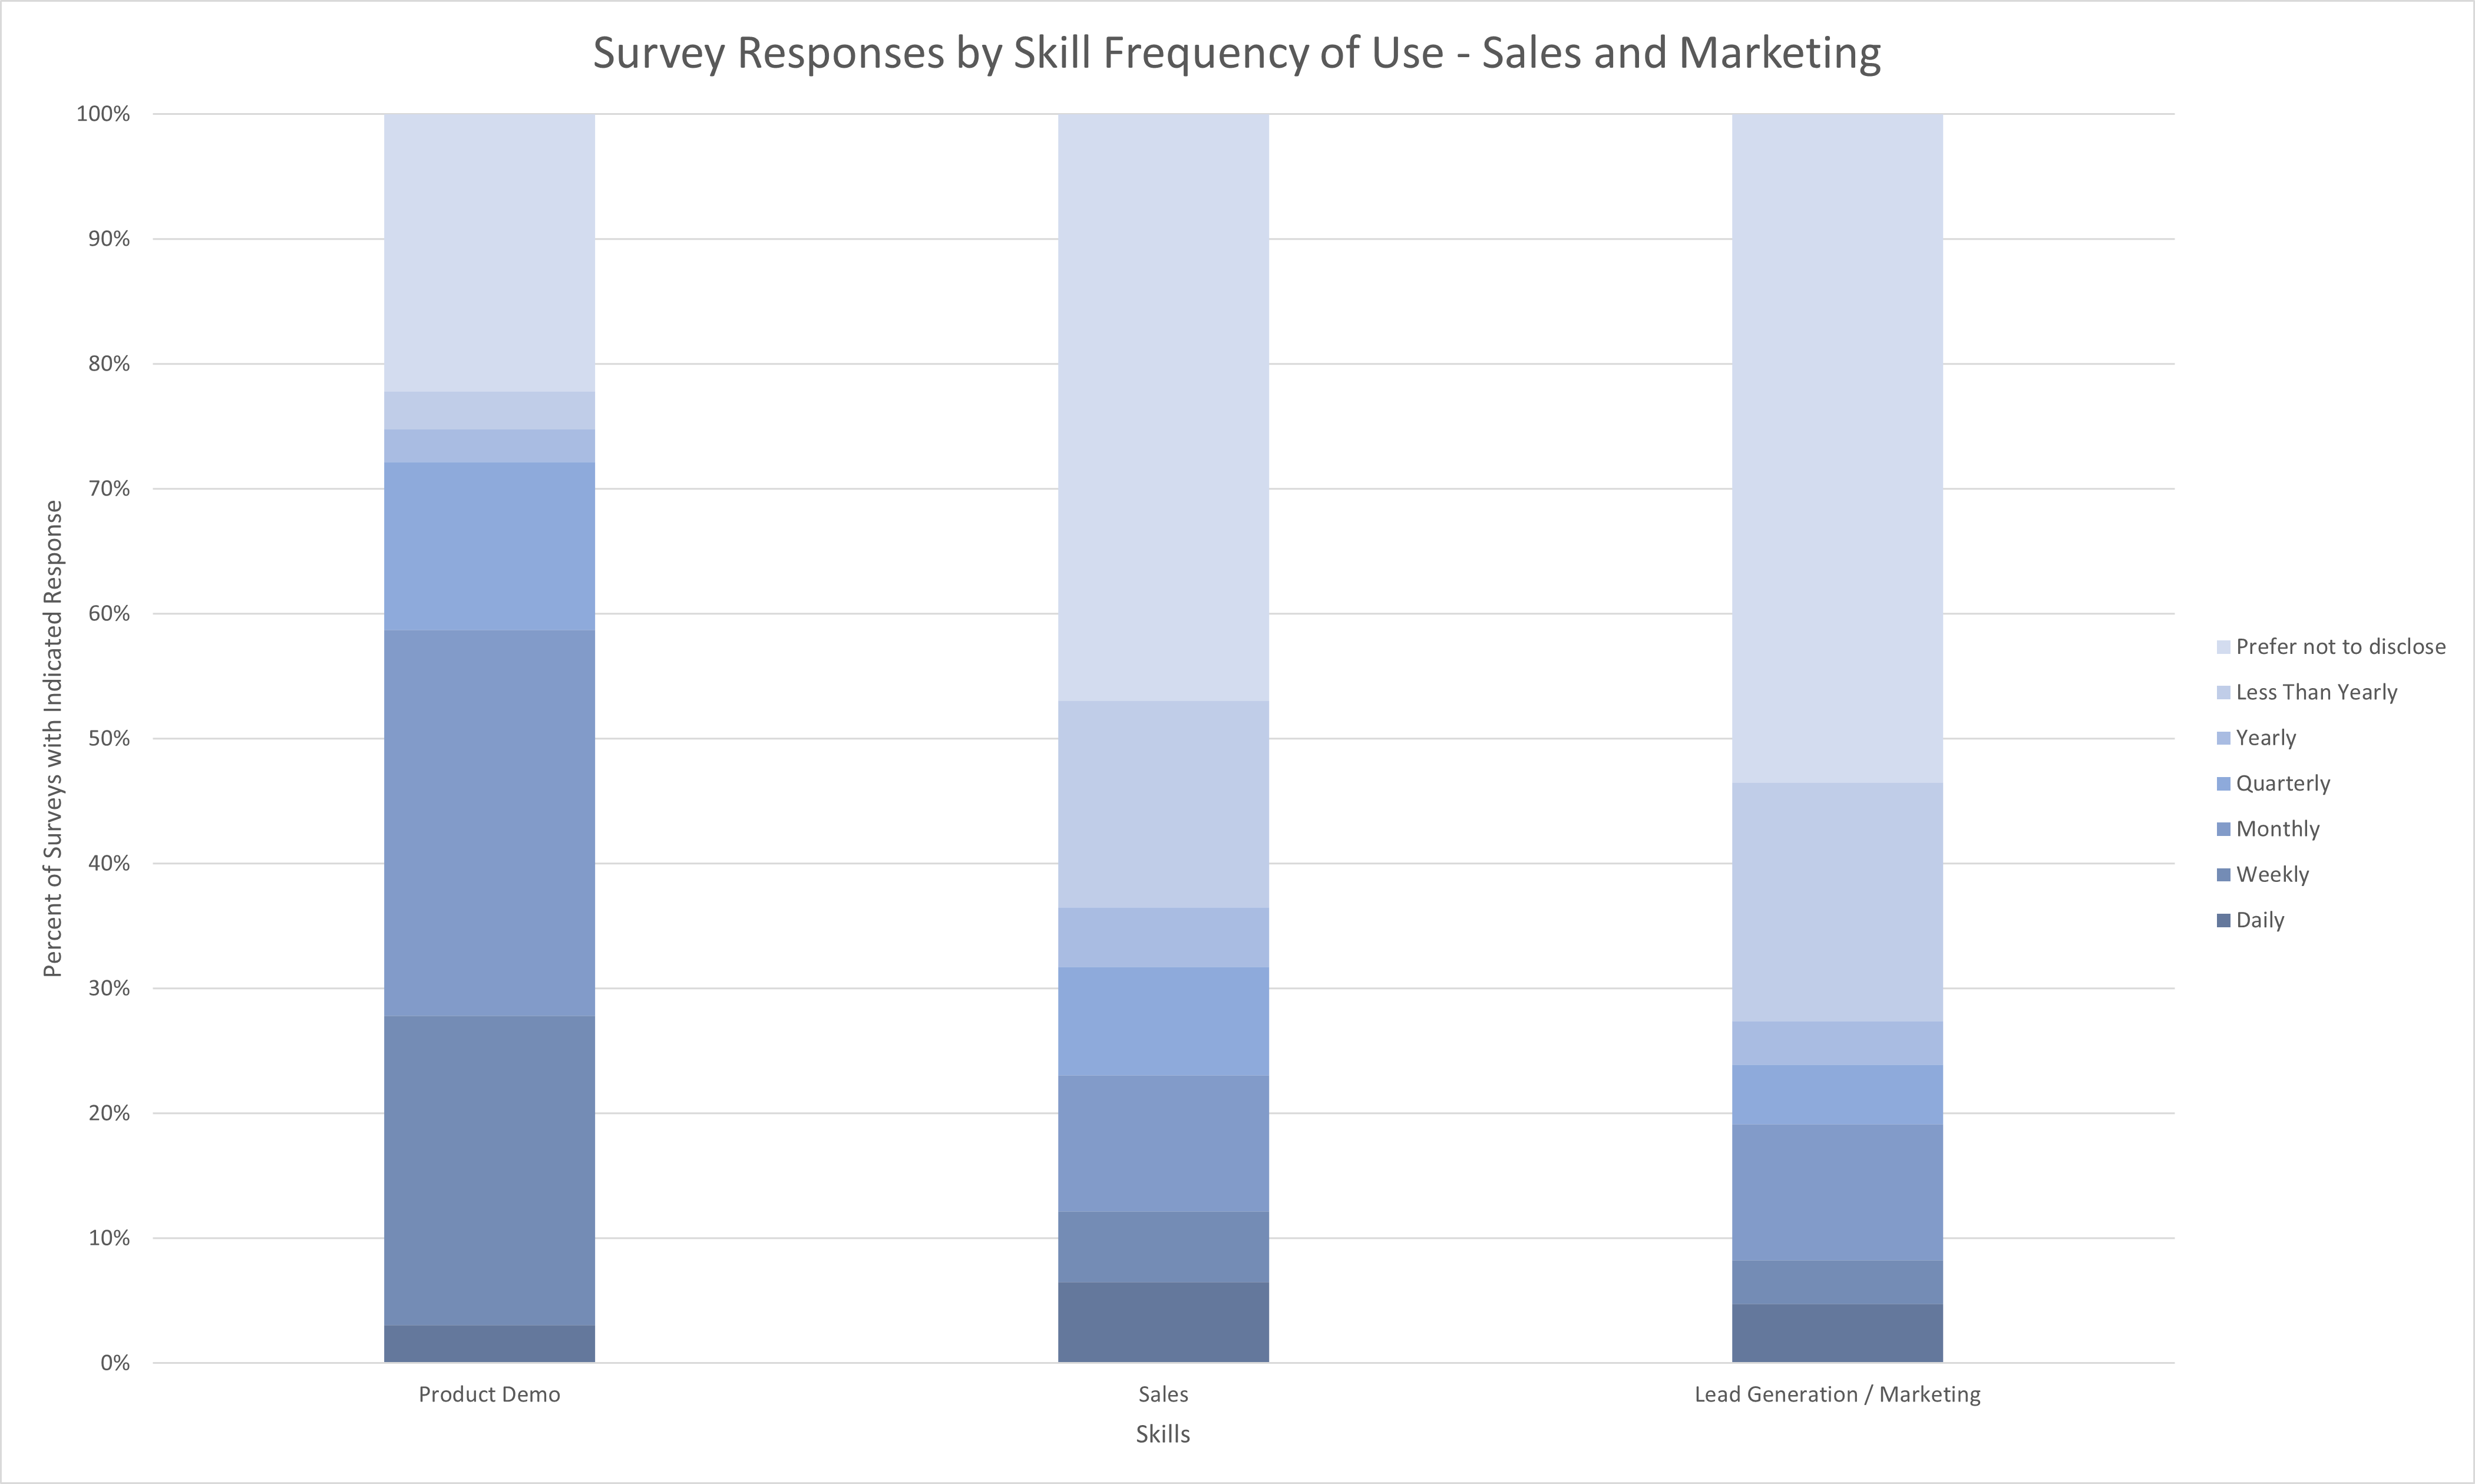
Survey Responses by Skill Frequency of Use - Sales and Marketing
Product Demo
Sales
Lead Generation / Marketing
Daily
3.04%
6.52%
4.78%
Weekly
24.78%
5.65%
3.48%
Monthly
30.87%
10.87%
10.87%
Quarterly
13.48%
8.70%
4.78%
Yearly
2.61%
4.78%
3.48%
Less Than Yearly
3.04%
16.52%
19.13%
Prefer not to disclose
22.17%
46.96%
53.48%
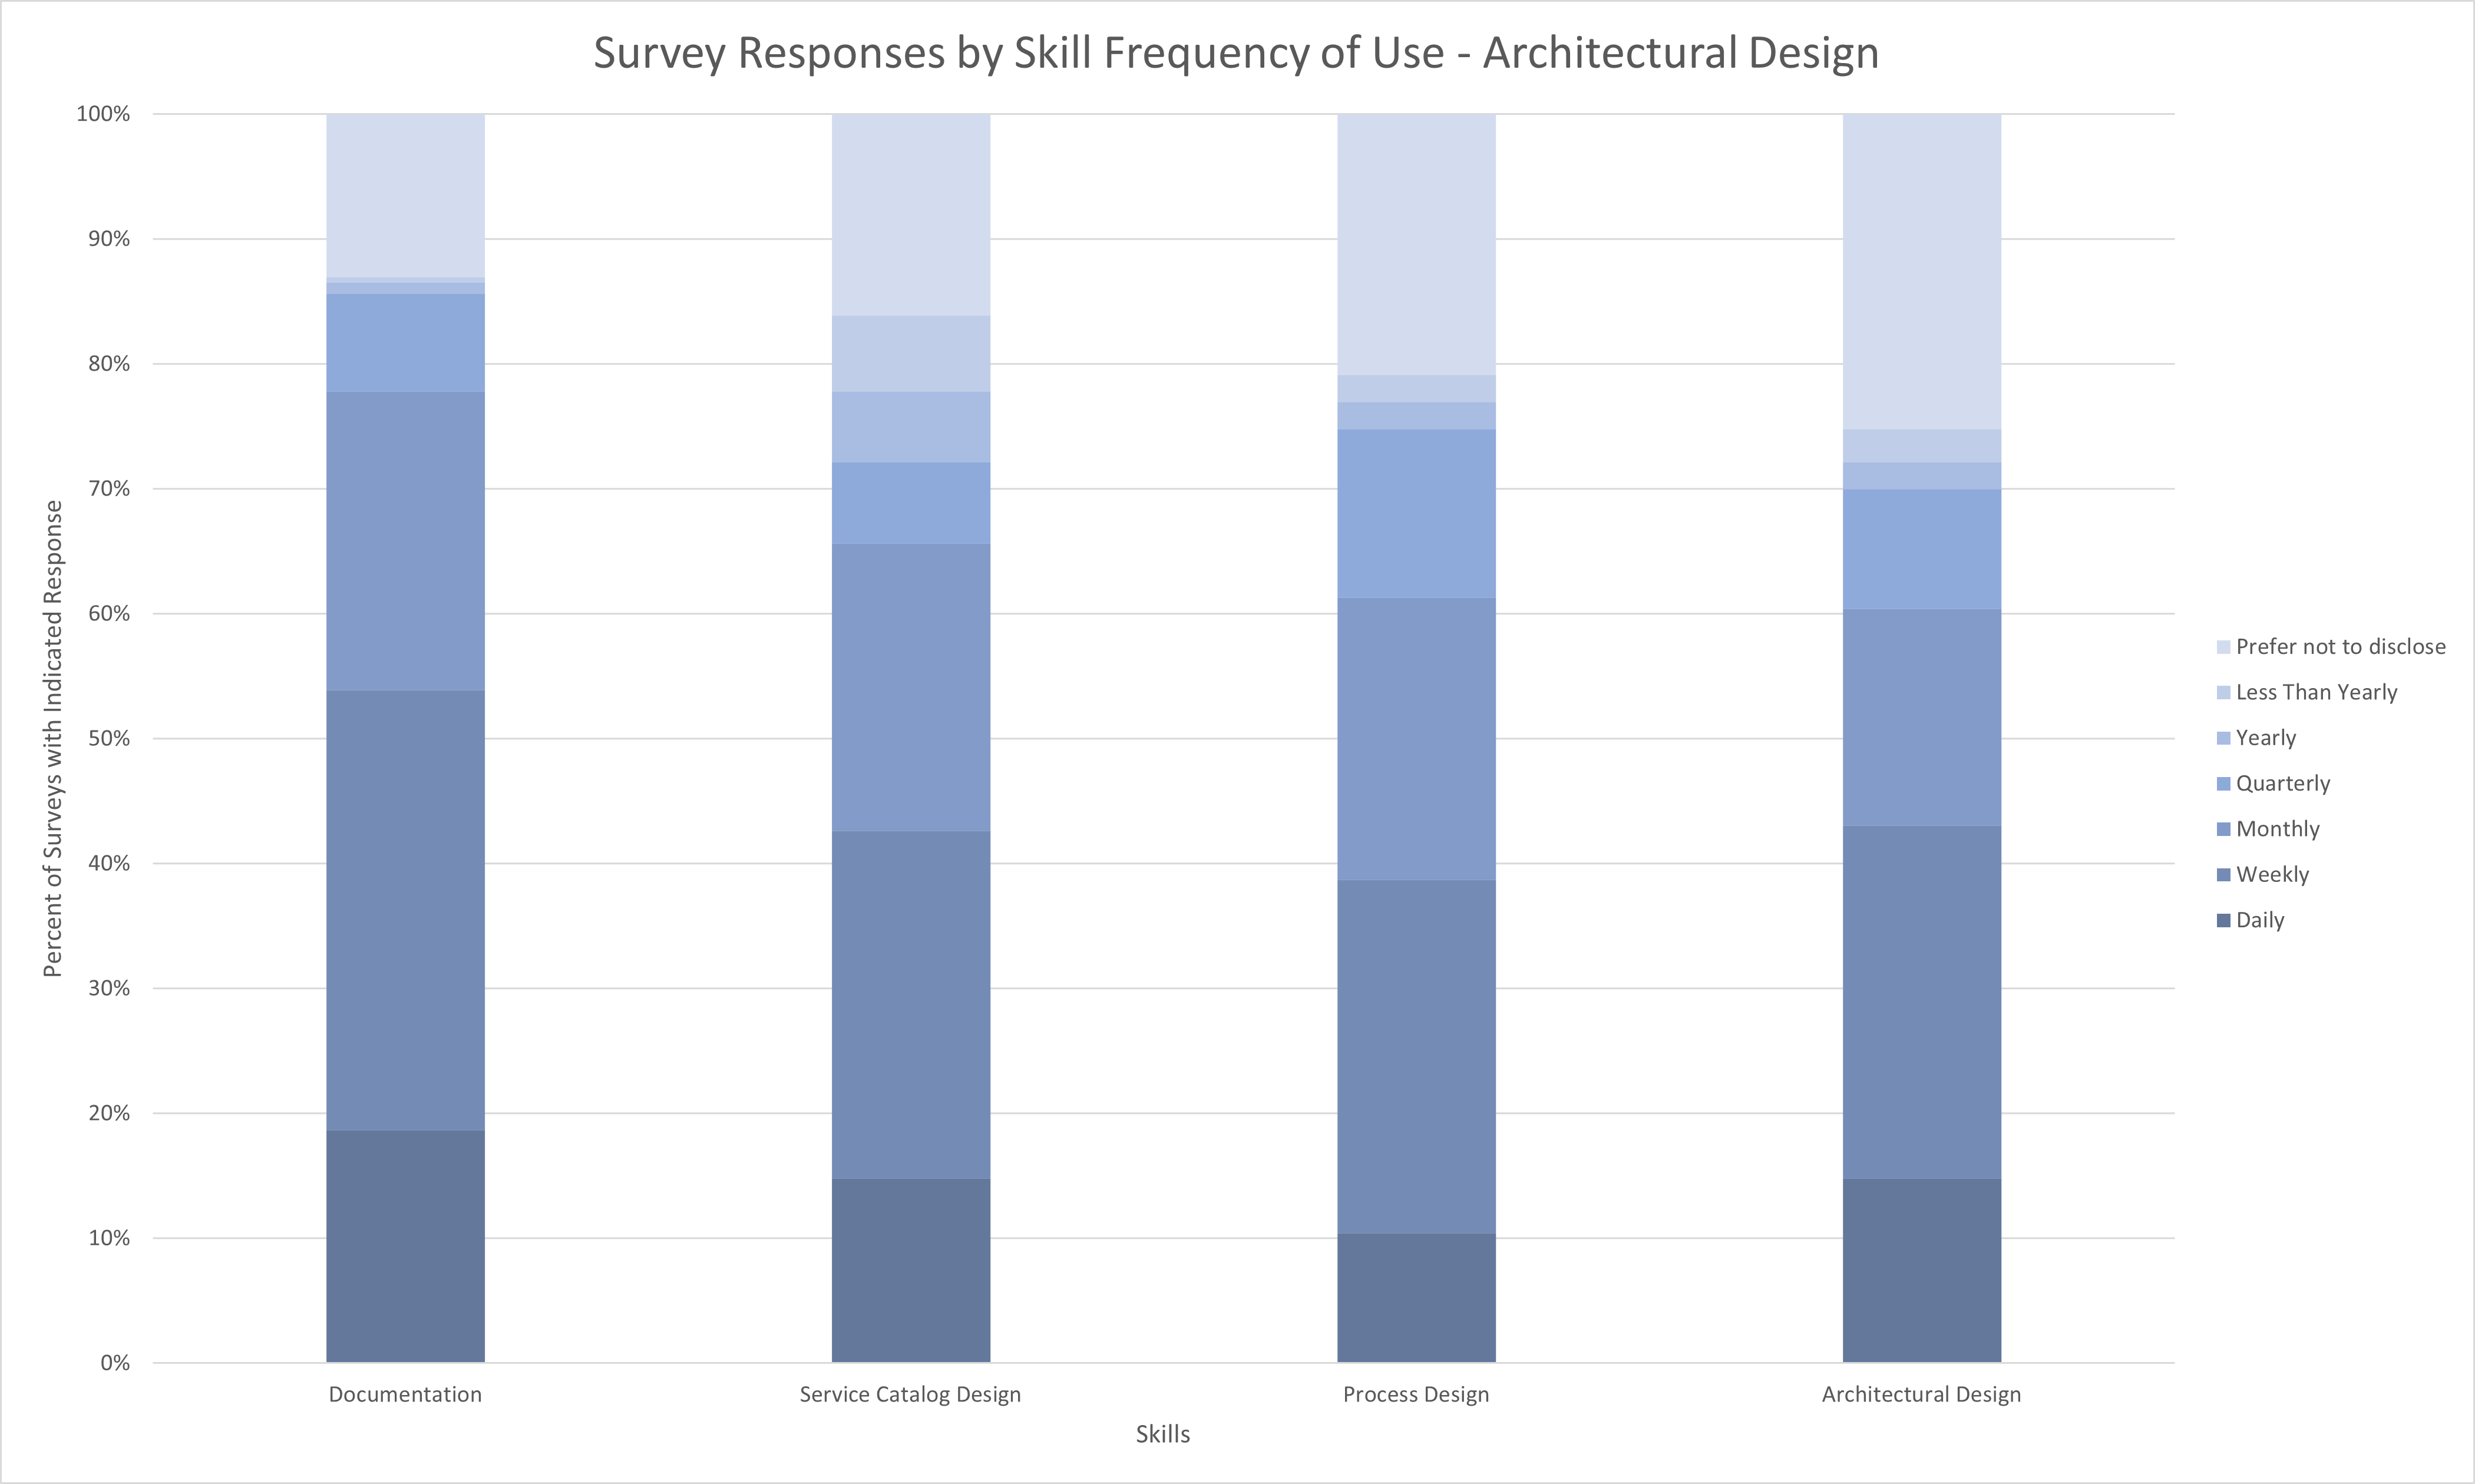
Survey Responses by Skill Frequency of Use - Architectural Design
Documentation
Service Catalog Design
Process Design
Architectural Design
Daily
18.70%
14.78%
10.43%
14.78%
Weekly
35.22%
27.83%
28.26%
28.26%
Monthly
23.91%
23.04%
22.61%
17.39%
Quarterly
7.83%
6.52%
13.48%
9.57%
Yearly
0.87%
5.65%
2.17%
2.17%
Less Than Yearly
0.43%
6.09%
2.17%
2.61%
Prefer not to disclose
13.04%
16.09%
20.87%
25.22%
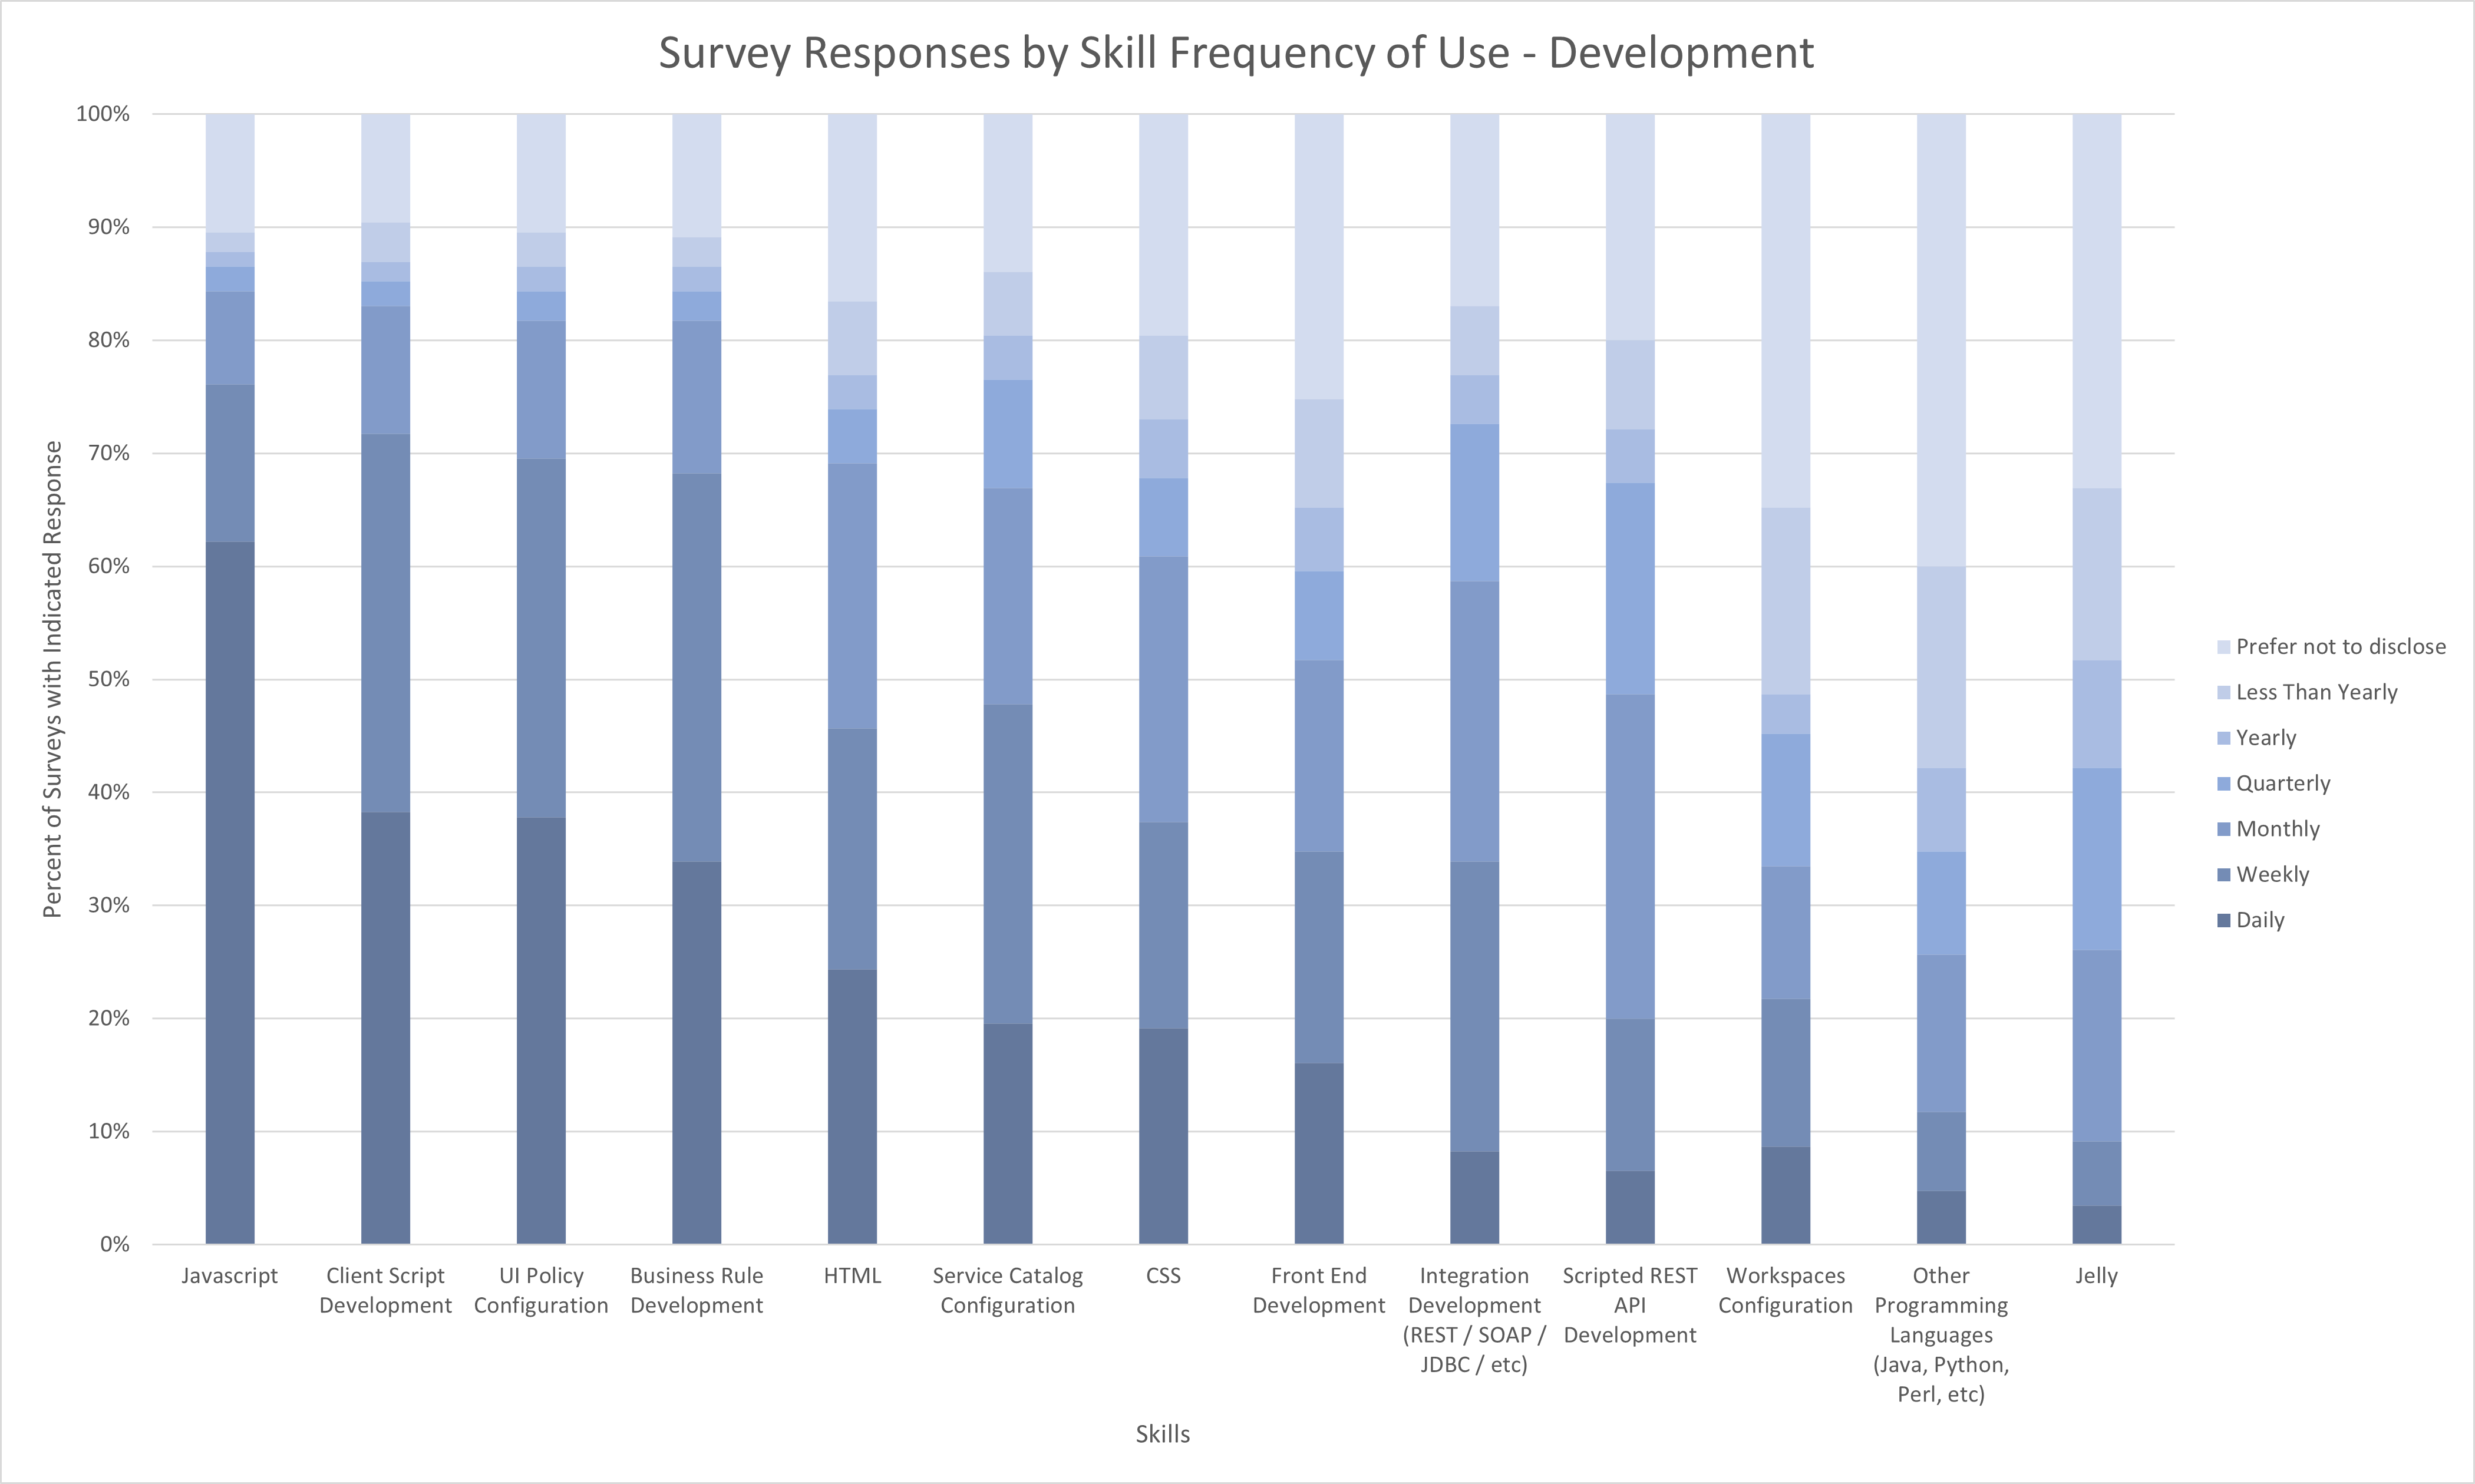
Survey Responses by Skill Frequency of Use - Development
Javascript
Client Script Development
UI Policy Configuration
Business Rule Development
HTML
Service Catalog Configuration
CSS
Front End Development
Integration Development (REST / SOAP / JDBC / etc)
Scripted REST API Development
Workspaces Configuration
Other Programming Languages (Java, Python, Perl, etc)
Jelly
Daily
62.17%
38.26%
37.83%
33.91%
24.35%
19.57%
19.13%
16.09%
8.26%
6.52%
8.70%
4.78%
3.48%
Weekly
13.91%
33.48%
31.74%
34.35%
21.30%
28.26%
18.26%
18.70%
25.65%
13.48%
13.04%
6.96%
5.65%
Monthly
8.26%
11.30%
12.17%
13.48%
23.48%
19.13%
23.48%
16.96%
24.78%
28.70%
11.74%
13.91%
16.96%
Quarterly
2.17%
2.17%
2.61%
2.61%
4.78%
9.57%
6.96%
7.83%
13.91%
18.70%
11.74%
9.13%
16.09%
Yearly
1.30%
1.74%
2.17%
2.17%
3.04%
3.91%
5.22%
5.65%
4.35%
4.78%
3.48%
7.39%
9.57%
Less Than Yearly
1.74%
3.48%
3.04%
2.61%
6.52%
5.65%
7.39%
9.57%
6.09%
7.83%
16.52%
17.83%
15.22%
Prefer not to disclose
10.43%
9.57%
10.43%
10.87%
16.52%
13.91%
19.57%
25.22%
16.96%
20.00%
34.78%
40.00%
33.04%
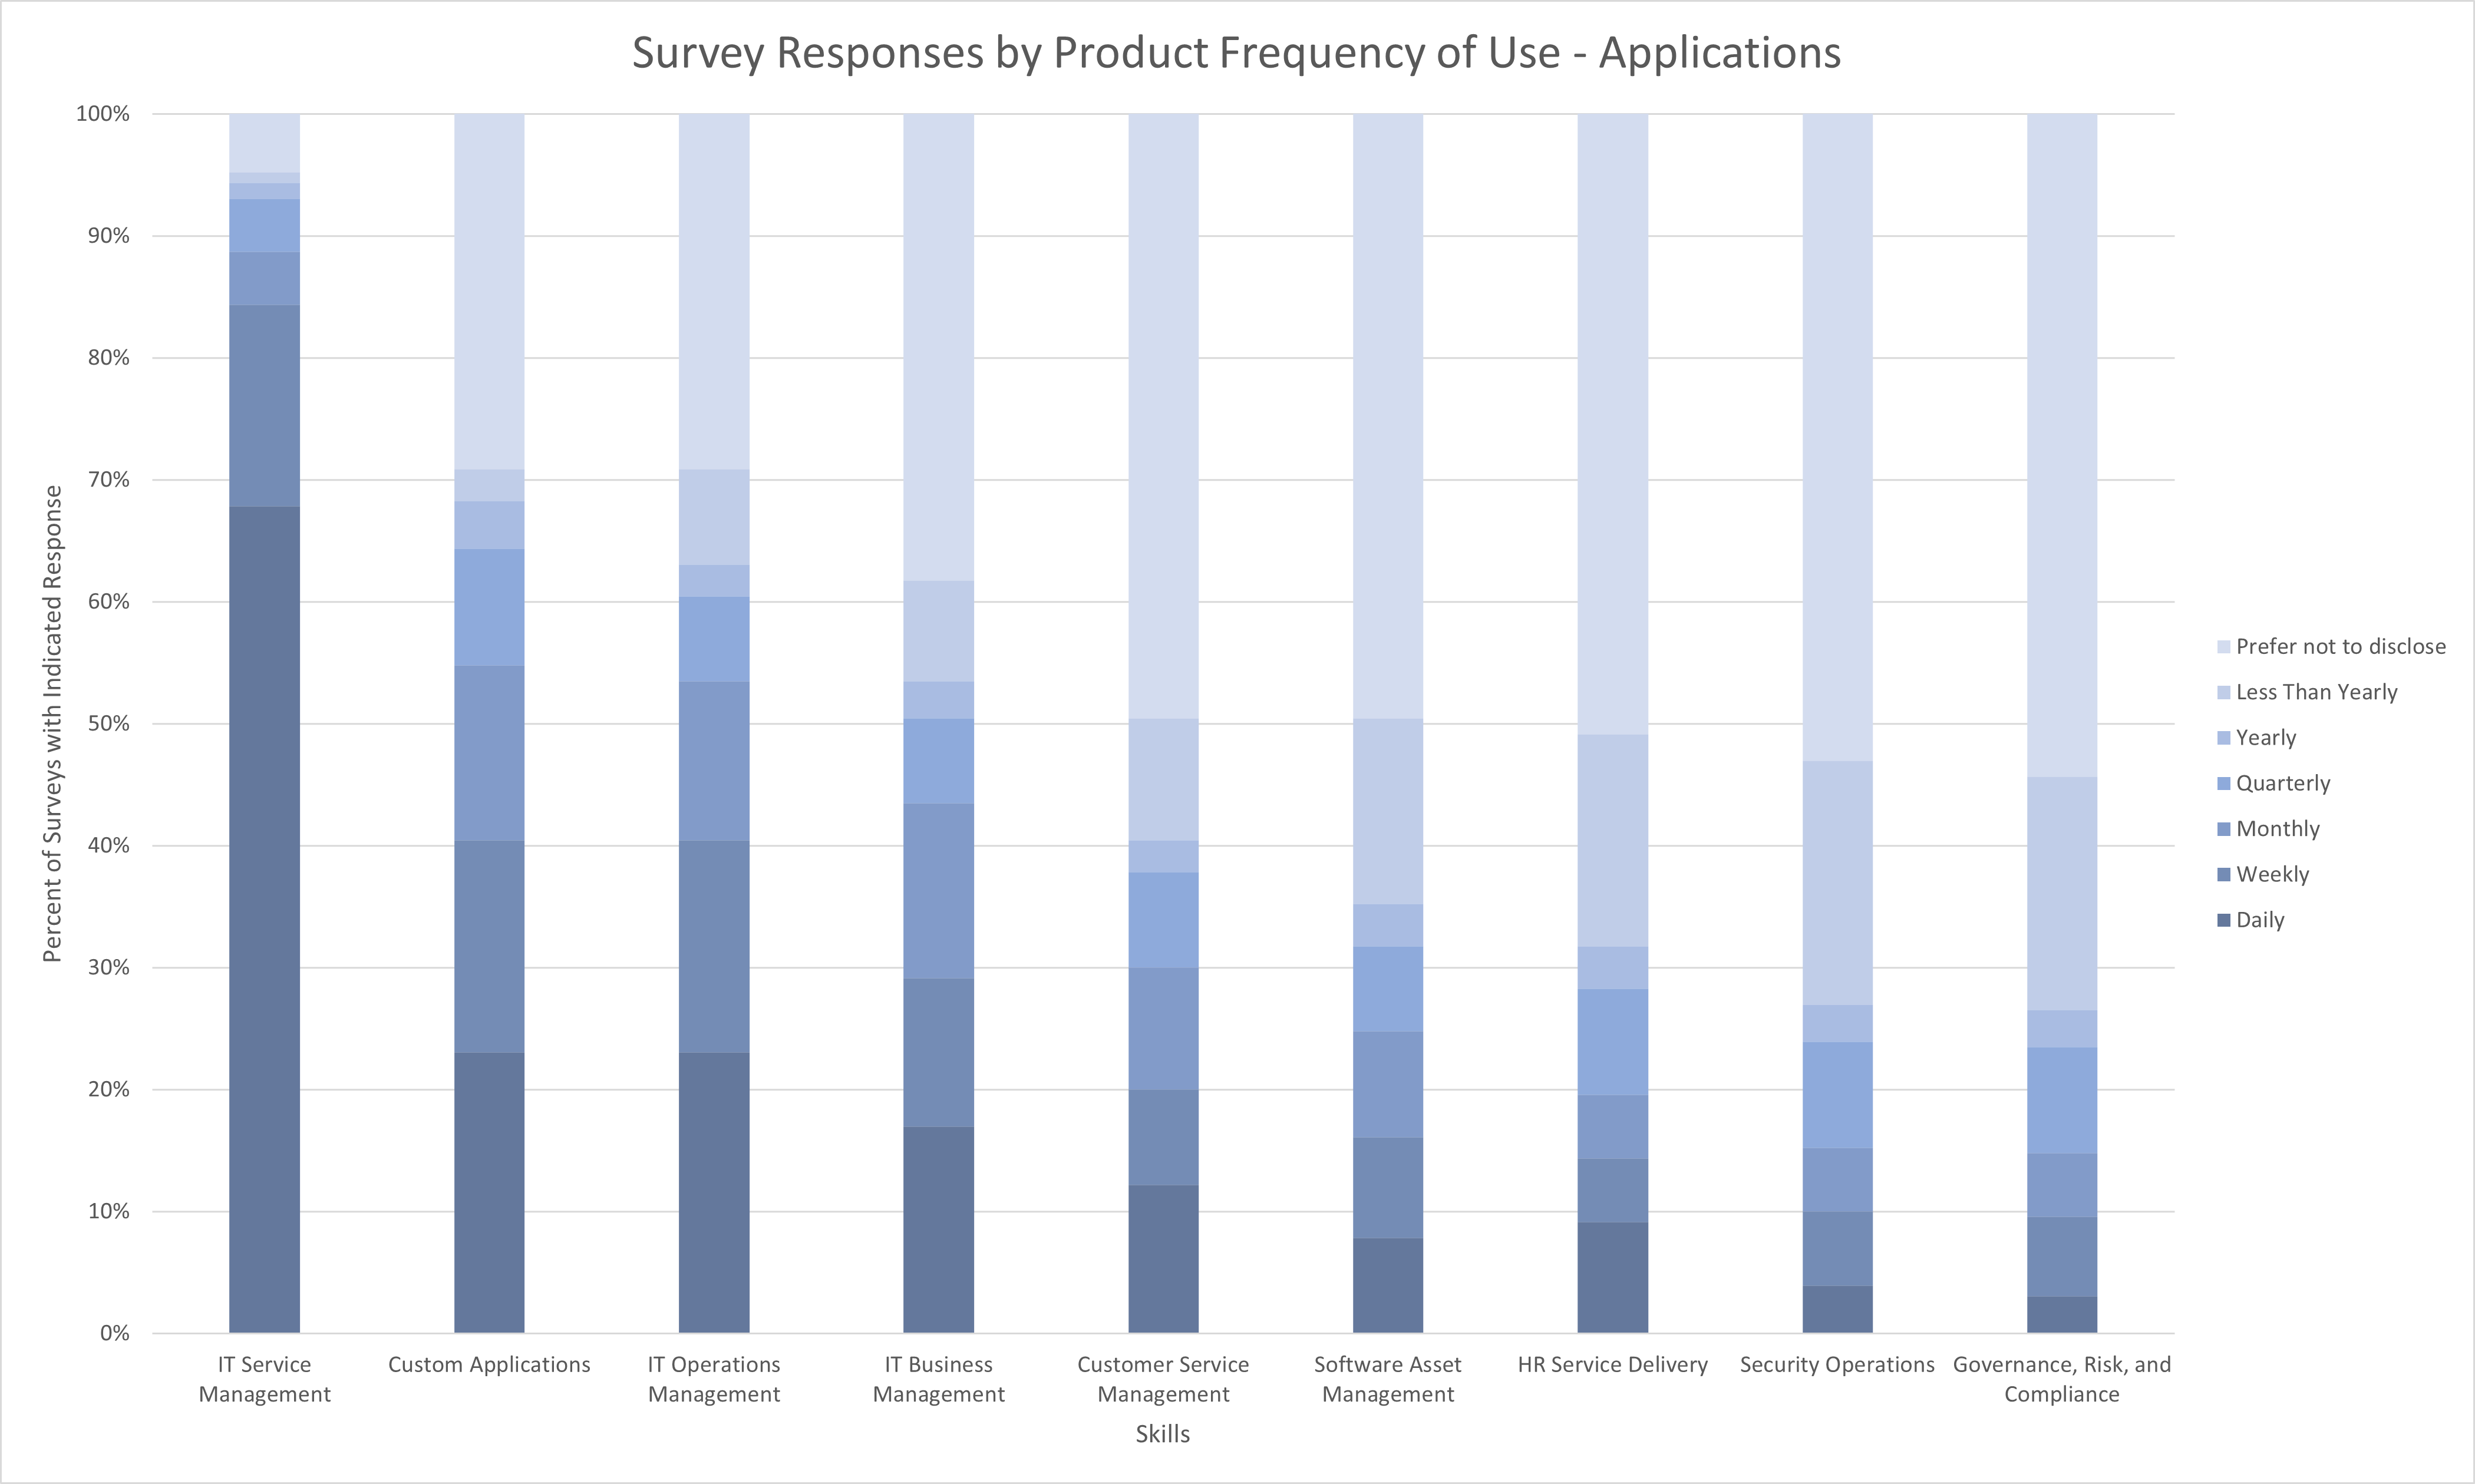
Survey Responses by Product Frequency of Use - Applications
IT Service Management
Custom Applications
IT Operations Management
IT Business Management
Customer Service Management
Software Asset Management
HR Service Delivery
Security Operations
Governance, Risk, and Compliance
Daily
67.83%
23.04%
23.04%
16.96%
12.17%
7.83%
9.13%
3.91%
3.04%
Weekly
16.52%
17.39%
17.39%
12.17%
7.83%
8.26%
5.22%
6.09%
6.52%
Monthly
4.35%
14.35%
13.04%
14.35%
10.00%
8.70%
5.22%
5.22%
5.22%
Quarterly
4.35%
9.57%
6.96%
6.96%
7.83%
6.96%
8.70%
8.70%
8.70%
Yearly
1.30%
3.91%
2.61%
3.04%
2.61%
3.48%
3.48%
3.04%
3.04%
Less Than Yearly
0.87%
2.61%
7.83%
8.26%
10.00%
15.22%
17.39%
20.00%
19.13%
Prefer not to disclose
4.78%
29.13%
29.13%
38.26%
49.57%
49.57%
50.87%
53.04%
54.35%
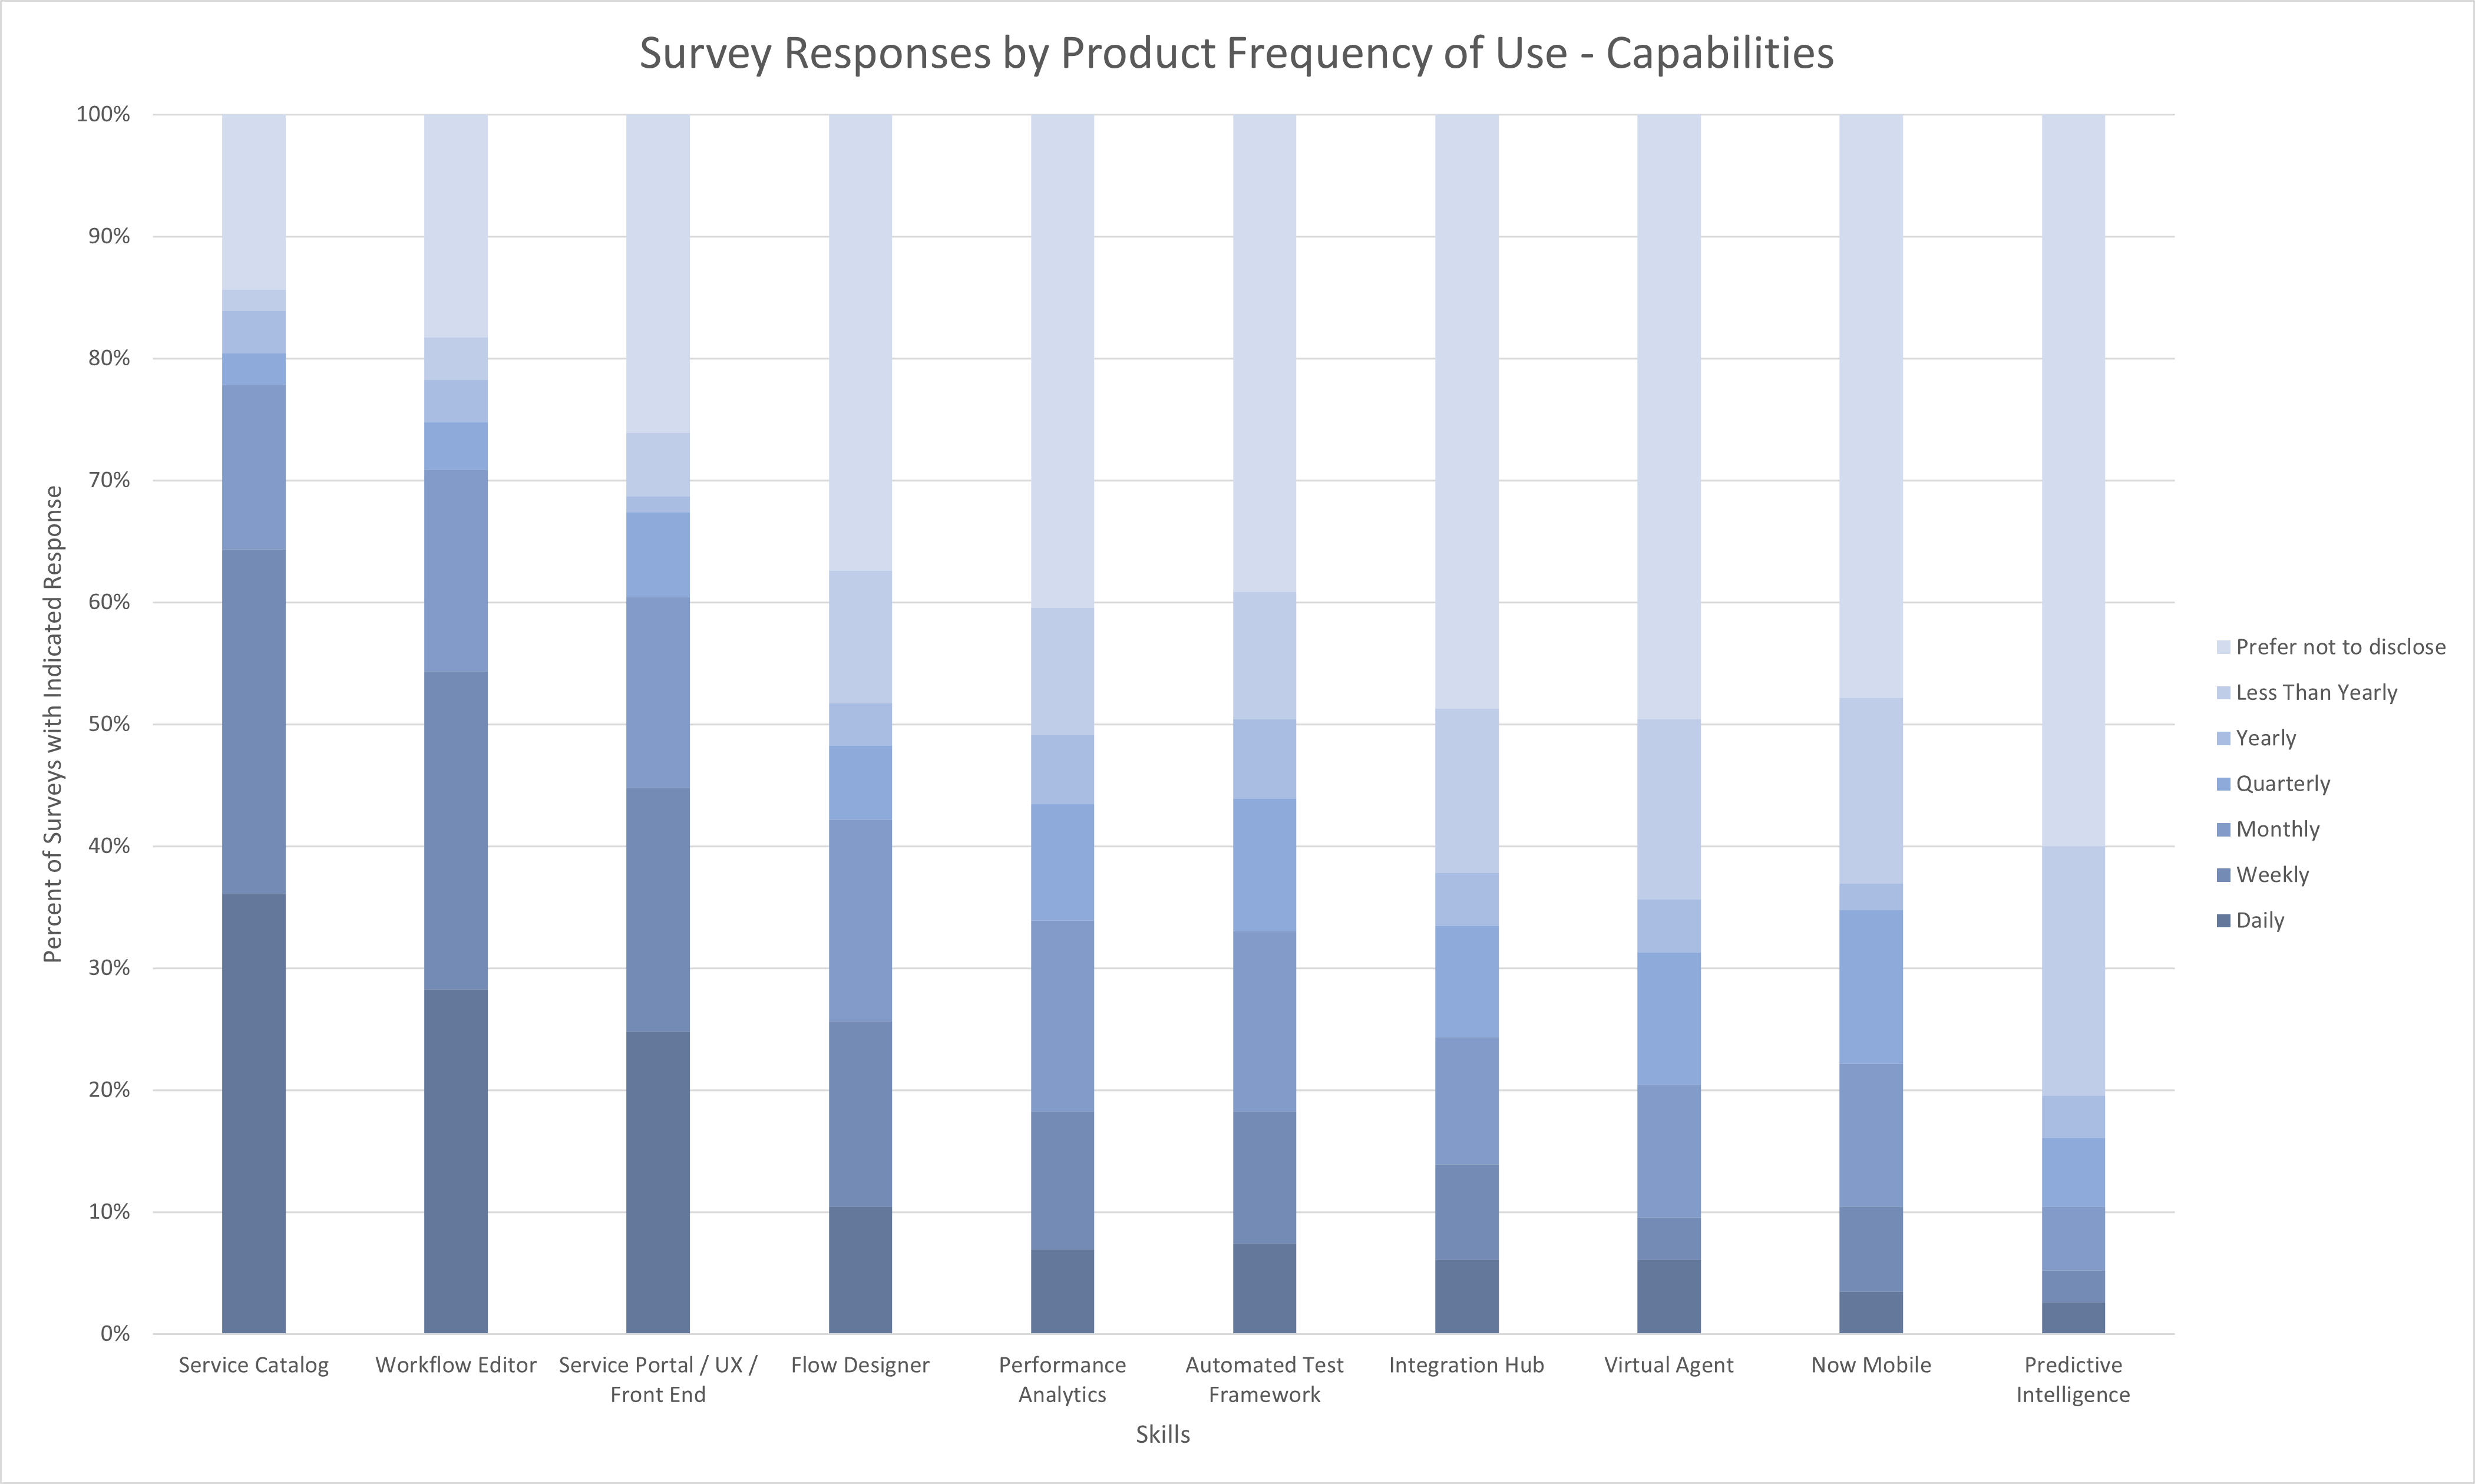
Survey Responses by Product Frequency of Use - Capabilities
Service Catalog
Workflow Editor
Service Portal / UX / Front End
Flow Designer
Performance Analytics
Automated Test Framework
Integration Hub
Virtual Agent
Now Mobile
Predictive Intelligence
Daily
36.09%
28.26%
24.78%
10.43%
6.96%
7.39%
6.09%
6.09%
3.48%
2.61%
Weekly
28.26%
26.09%
20.00%
15.22%
11.30%
10.87%
7.83%
3.48%
6.96%
2.61%
Monthly
13.48%
16.52%
15.65%
16.52%
15.65%
14.78%
10.43%
10.87%
11.74%
5.22%
Quarterly
2.61%
3.91%
6.96%
6.09%
9.57%
10.87%
9.13%
10.87%
12.61%
5.65%
Yearly
3.48%
3.48%
1.30%
3.48%
5.65%
6.52%
4.35%
4.35%
2.17%
3.48%
Less Than Yearly
1.74%
3.48%
5.22%
10.87%
10.43%
10.43%
13.48%
14.78%
15.22%
20.43%
Prefer not to disclose
14.35%
18.26%
26.09%
37.39%
40.43%
39.13%
48.70%
49.57%
47.83%
60.00%
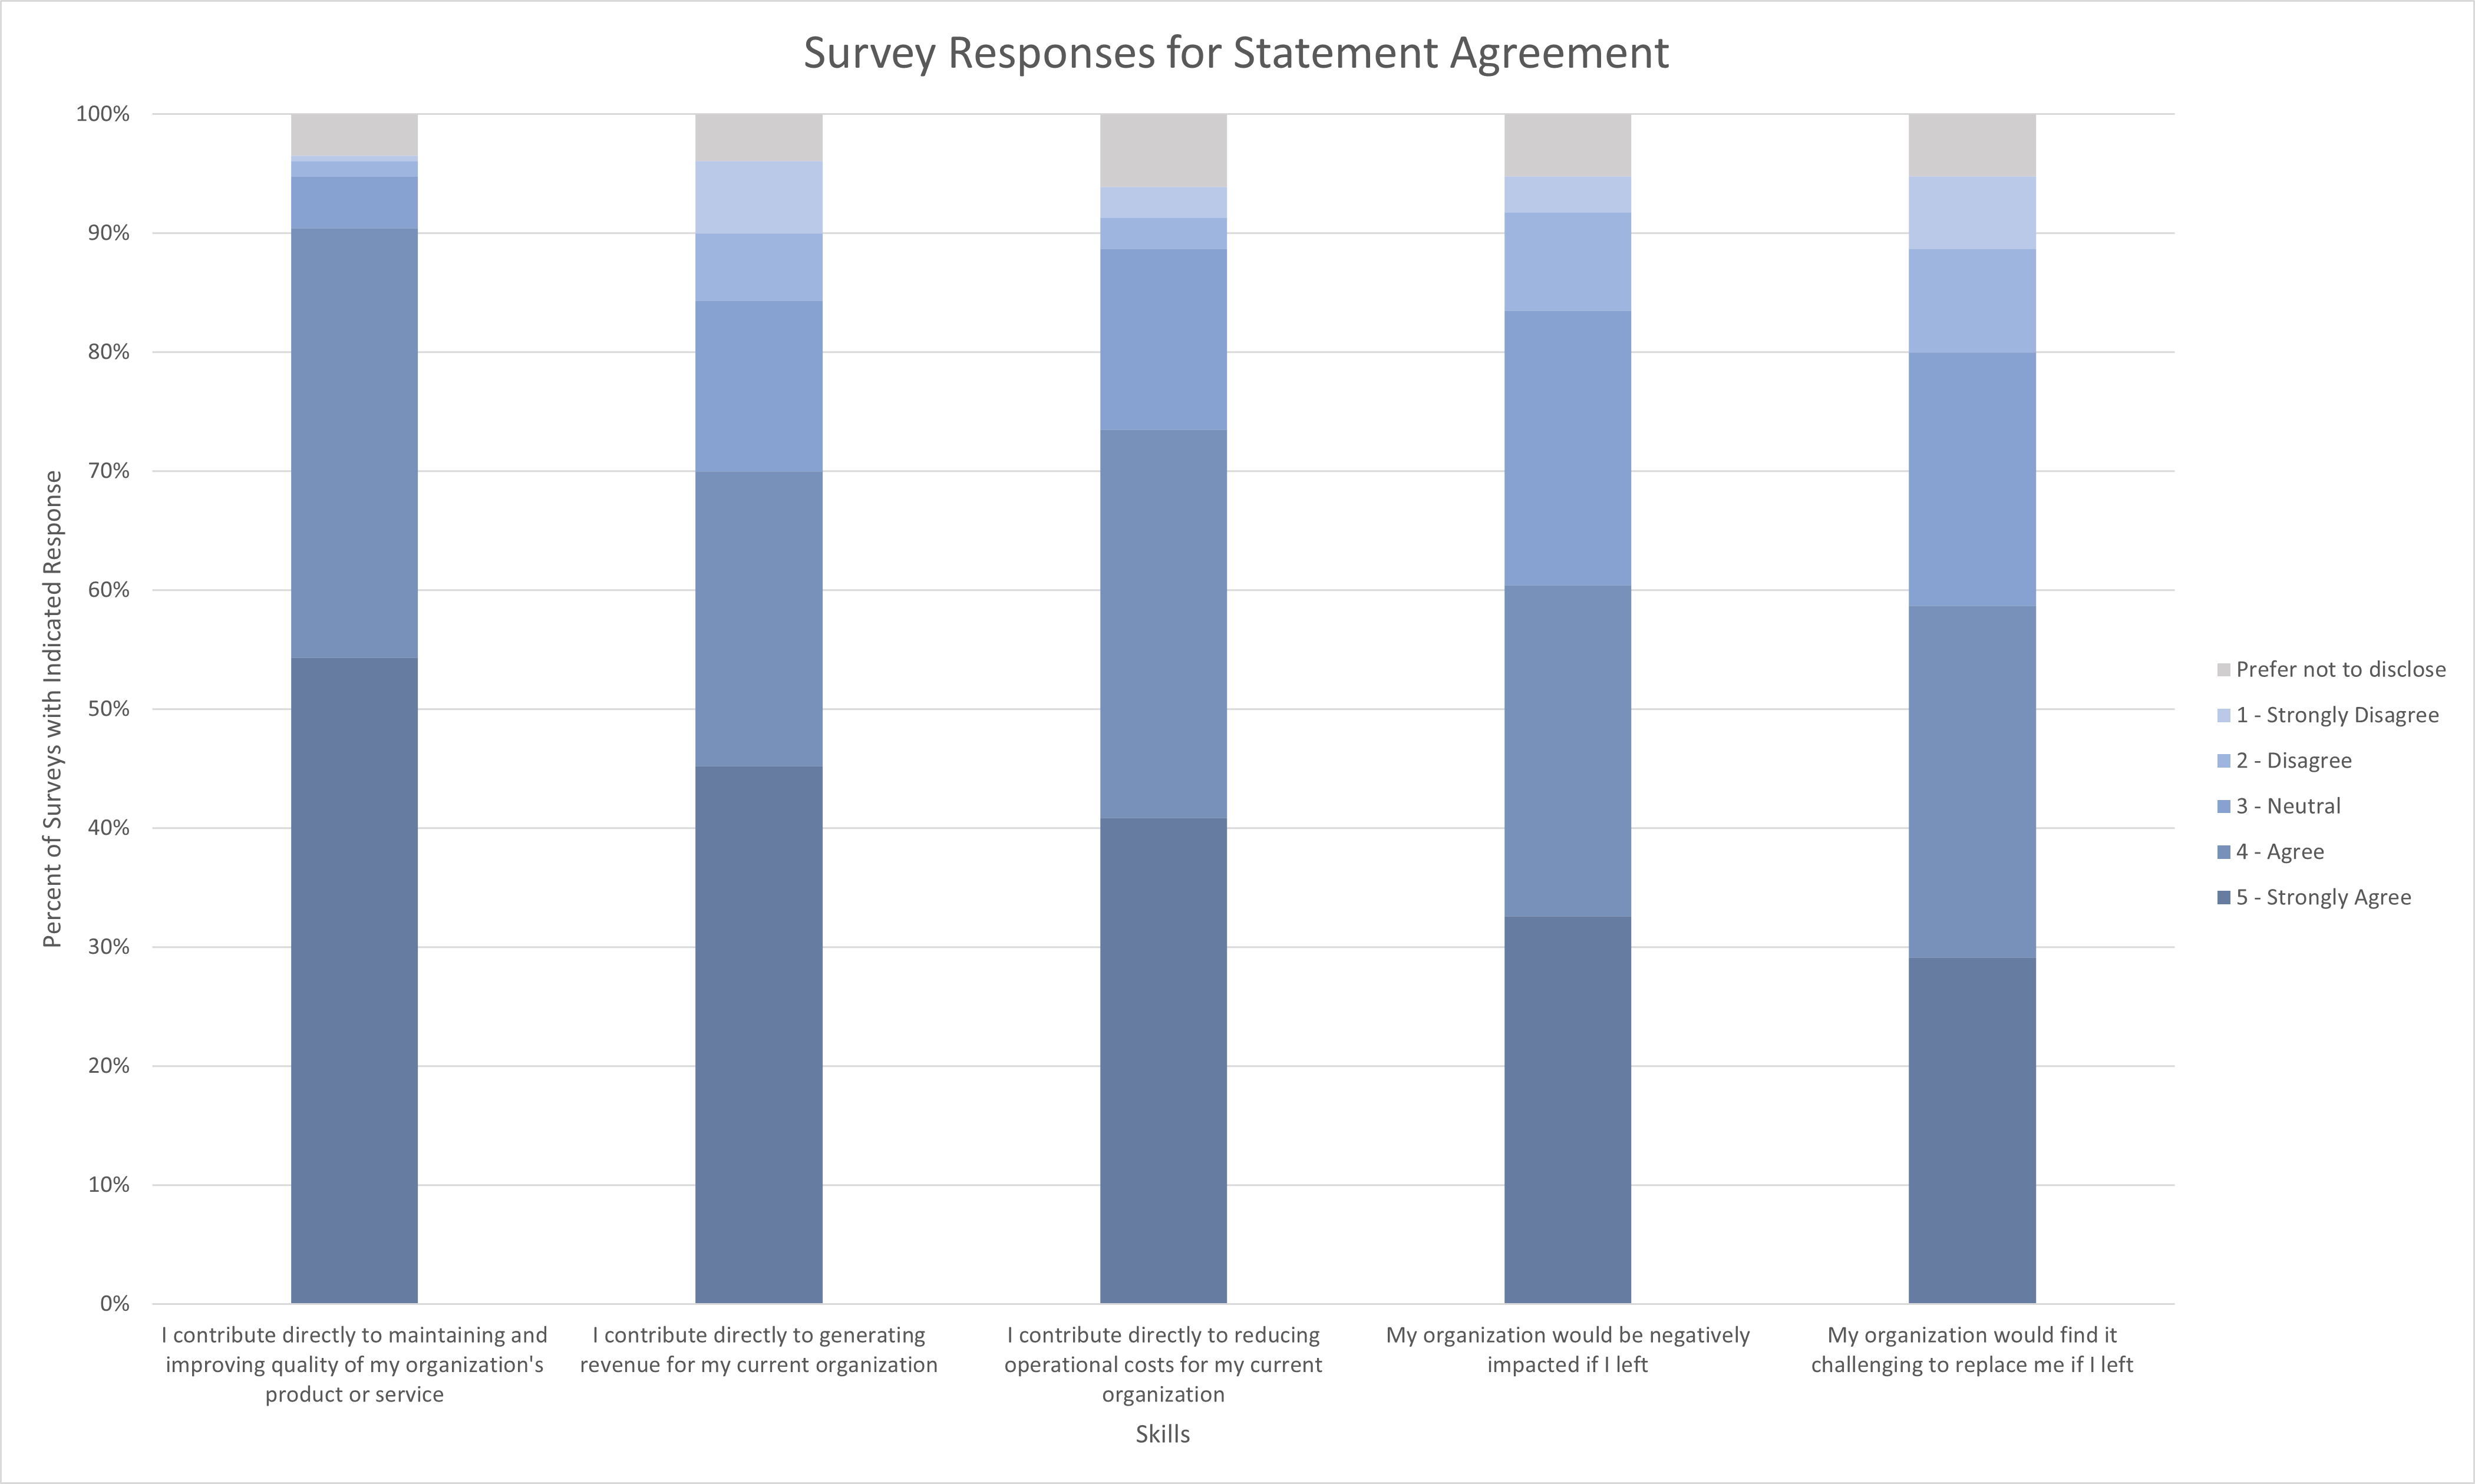
Please rate the degree to which you agree with the following statements
Survey Responses for Statement Agreement
I contribute directly to maintaining and improving quality of my organization’s product or service
I contribute directly to generating revenue for my current organization
I contribute directly to reducing operational costs for my current organization
My organization would be negatively impacted if I left
My organization would find it challenging to replace me if I left
5 - Strongly Agree
54.35%
45.22%
40.87%
32.61%
29.13%
4 - Agree
36.09%
24.78%
32.61%
27.83%
29.57%
3 - Neutral
4.35%
14.35%
15.22%
23.04%
21.30%
2 - Disagree
1.30%
5.65%
2.61%
8.26%
8.70%
1 - Strongly Disagree
0.43%
6.09%
2.61%
3.04%
6.09%
Prefer not to disclose
3.48%
3.91%
6.09%
5.22%
5.22%
Please rate the degree to which you are satisfied with the following
Survey Responses for Satisfaction With Each Category
Your current employer
Your current role
Your future career prospects
Your current pay / compensation
5 - Very Satisfied
25.65%
23.48%
26.52%
16.09%
4 - Satisfied
43.91%
45.65%
36.09%
36.96%
3 - Neither satisfied nor dissatisfied
18.26%
20.43%
24.35%
17.39%
2 - Dissatisfied
9.57%
6.09%
9.13%
20.00%
1 - Very Dissatisfied
0.87%
2.17%
1.30%
7.83%
Prefer not to disclose
1.74%
2.17%
2.61%
1.74%
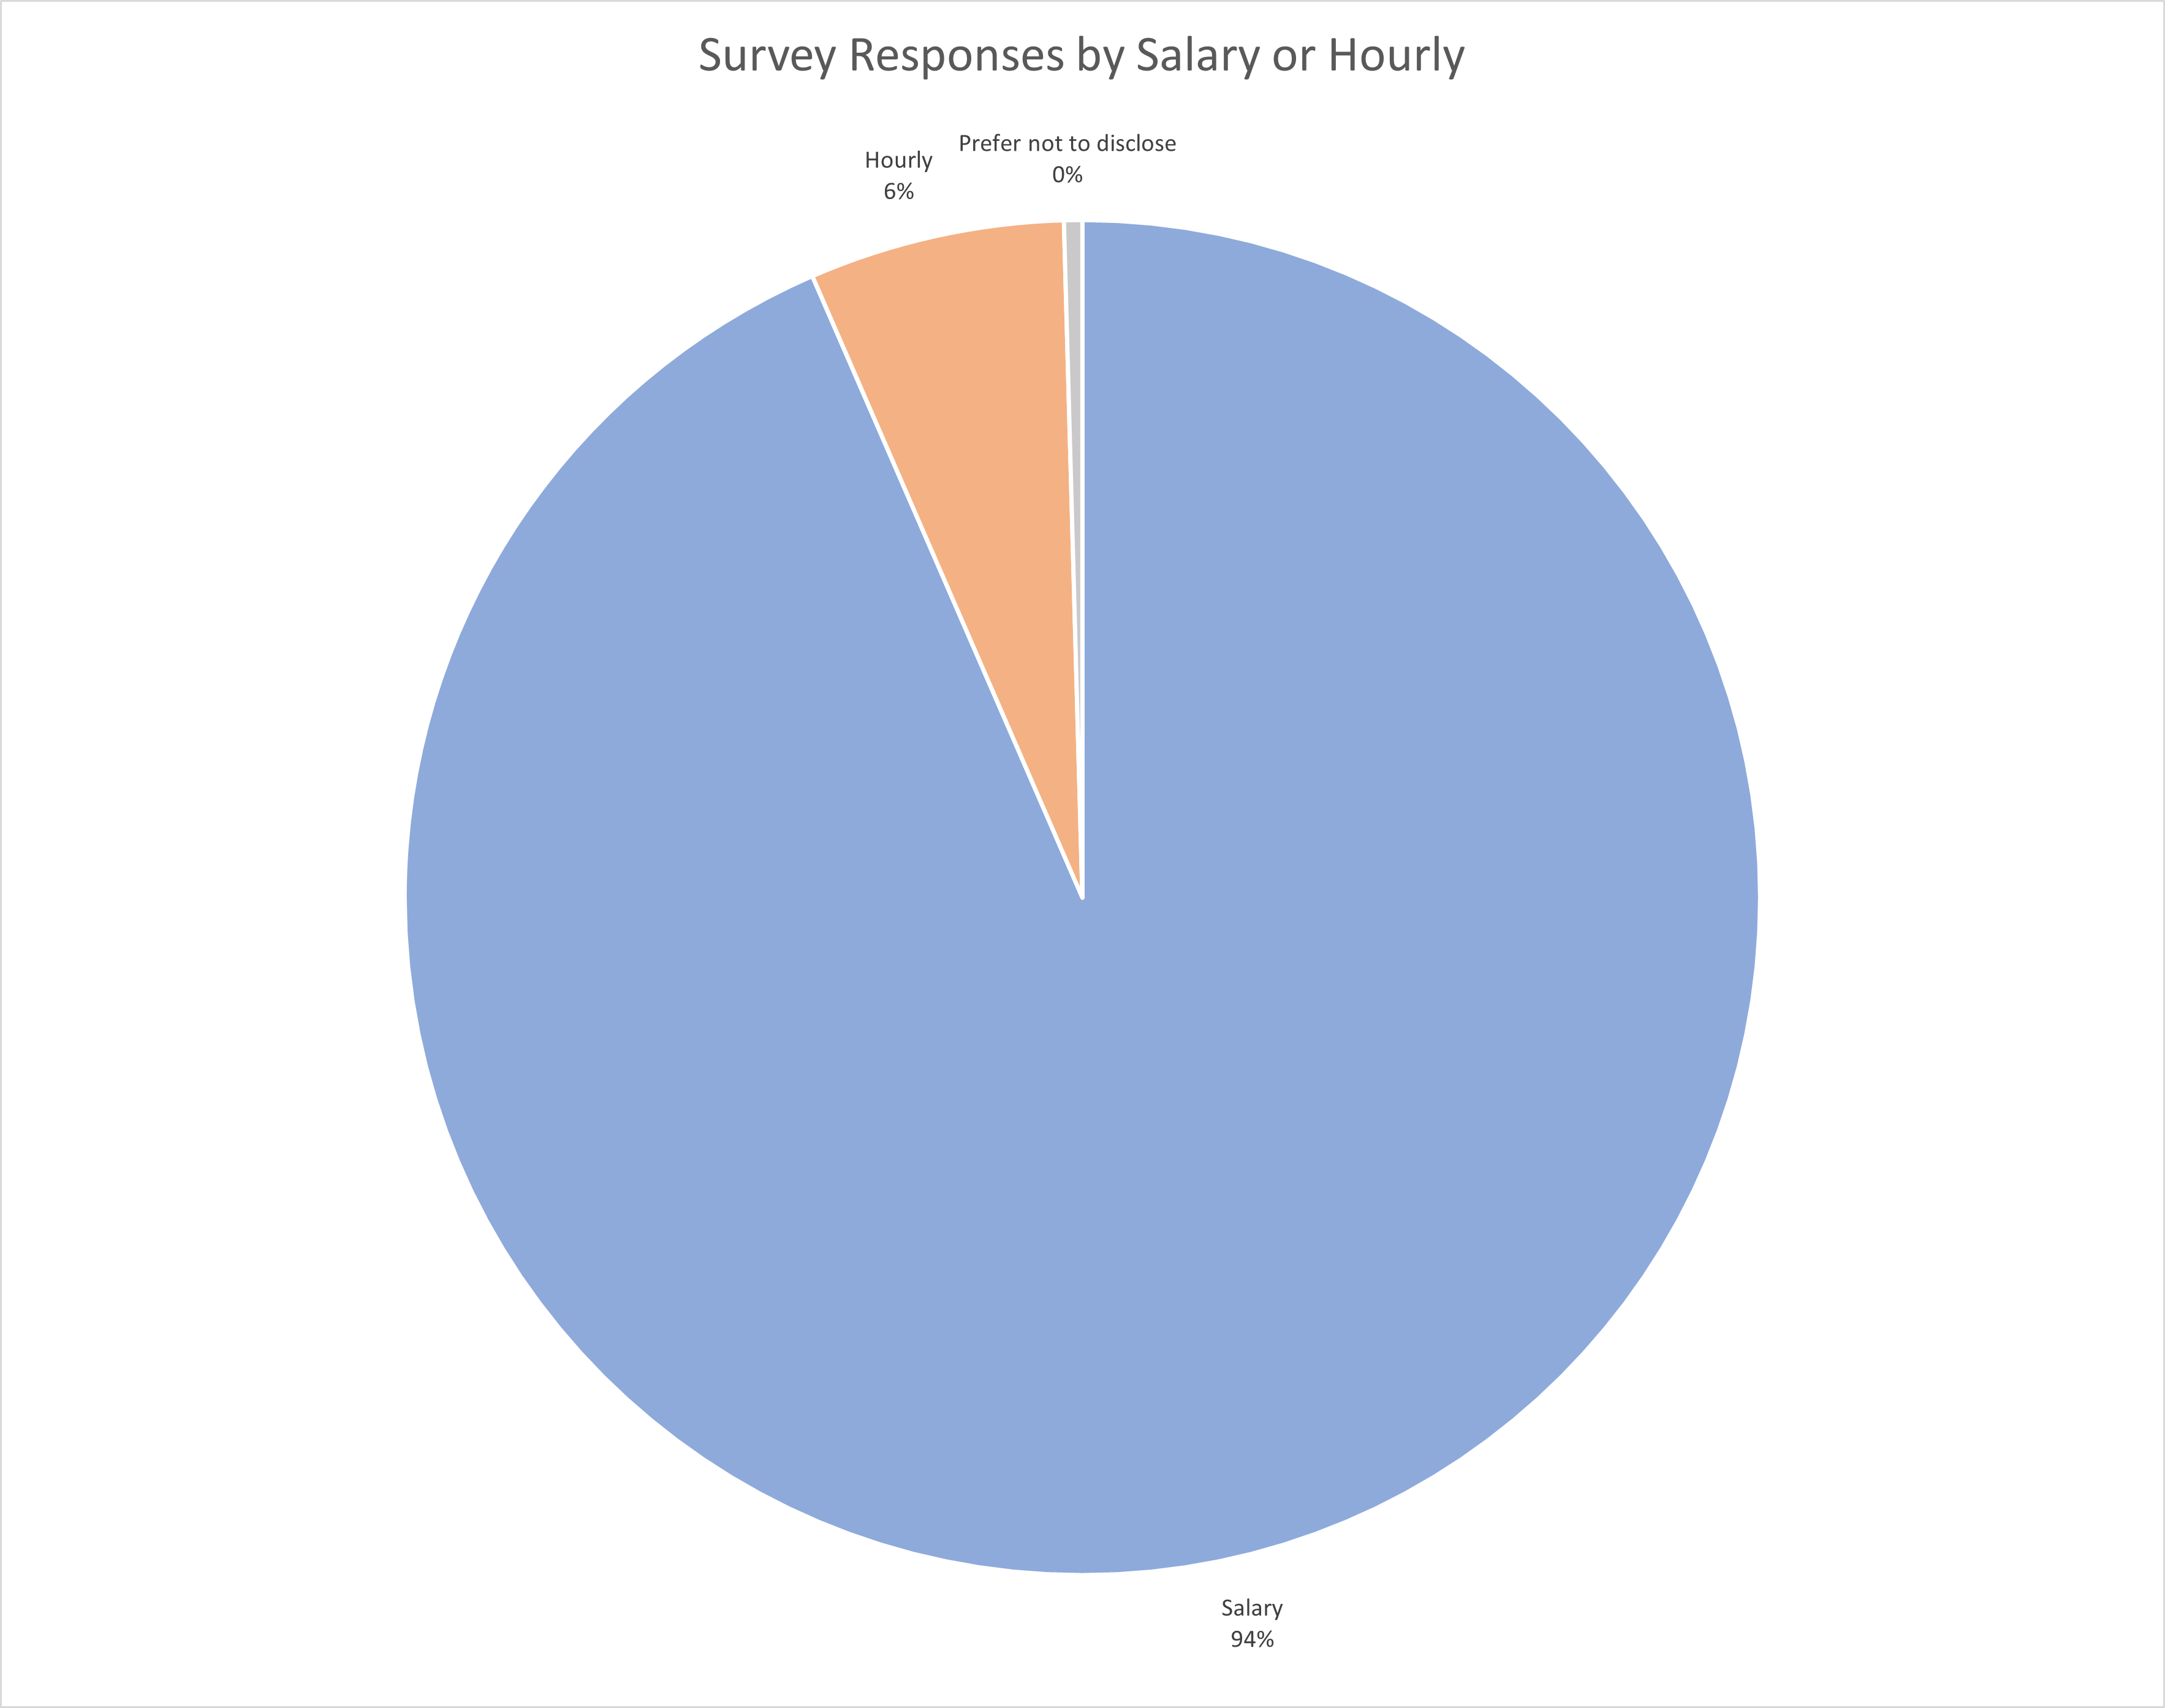
Are you currently paid Salary or Hourly?
Survey Responses by Salary or Hourly
Response
Percent of Respondents
Salary
93.48%
Hourly
6.09%
Prefer not to disclose
0.43%