Guide
Reference: Years of Experience Scatter Plots
This reference page contains the scatter plots depicting the relationship between years of experience and median compensation as discussed in the Top Influencing Features section of the report.
Australia Based
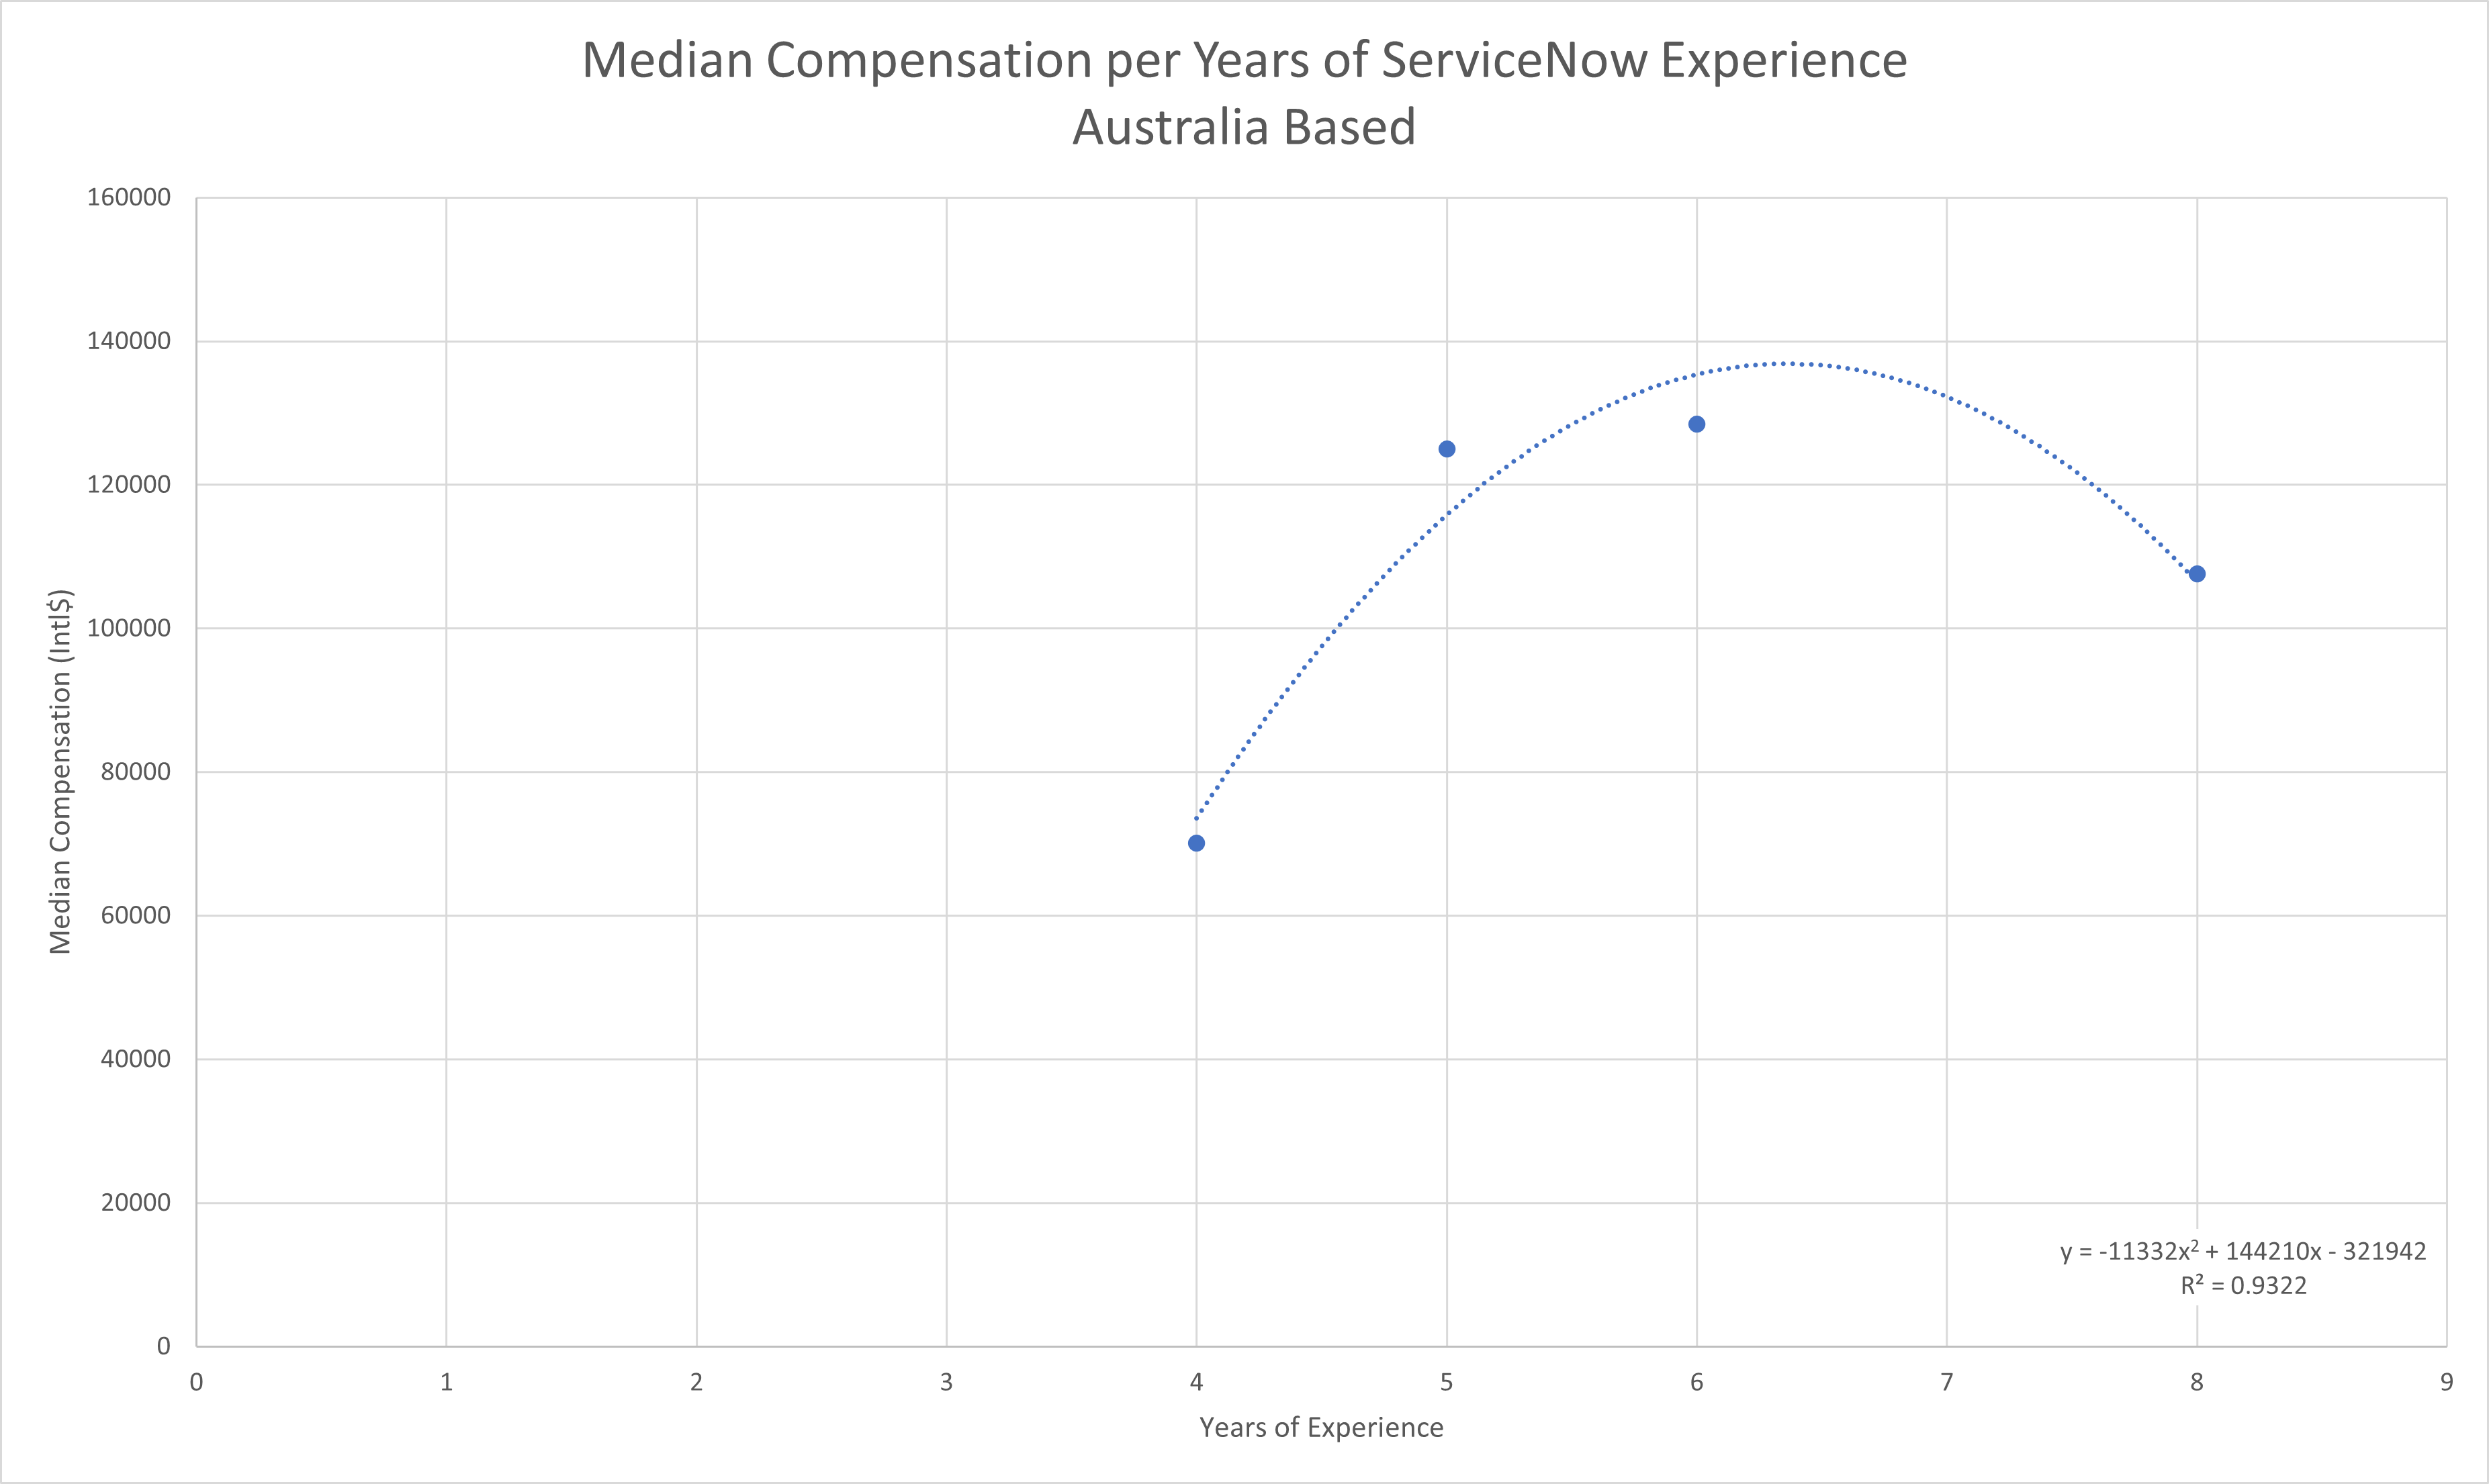
| Years | Median Compensation |
|---|---|
| 4 | 70,139 |
| 5 | 125,000 |
| 6 | 128,472 |
| 8 | 107,639 |
Canada Based
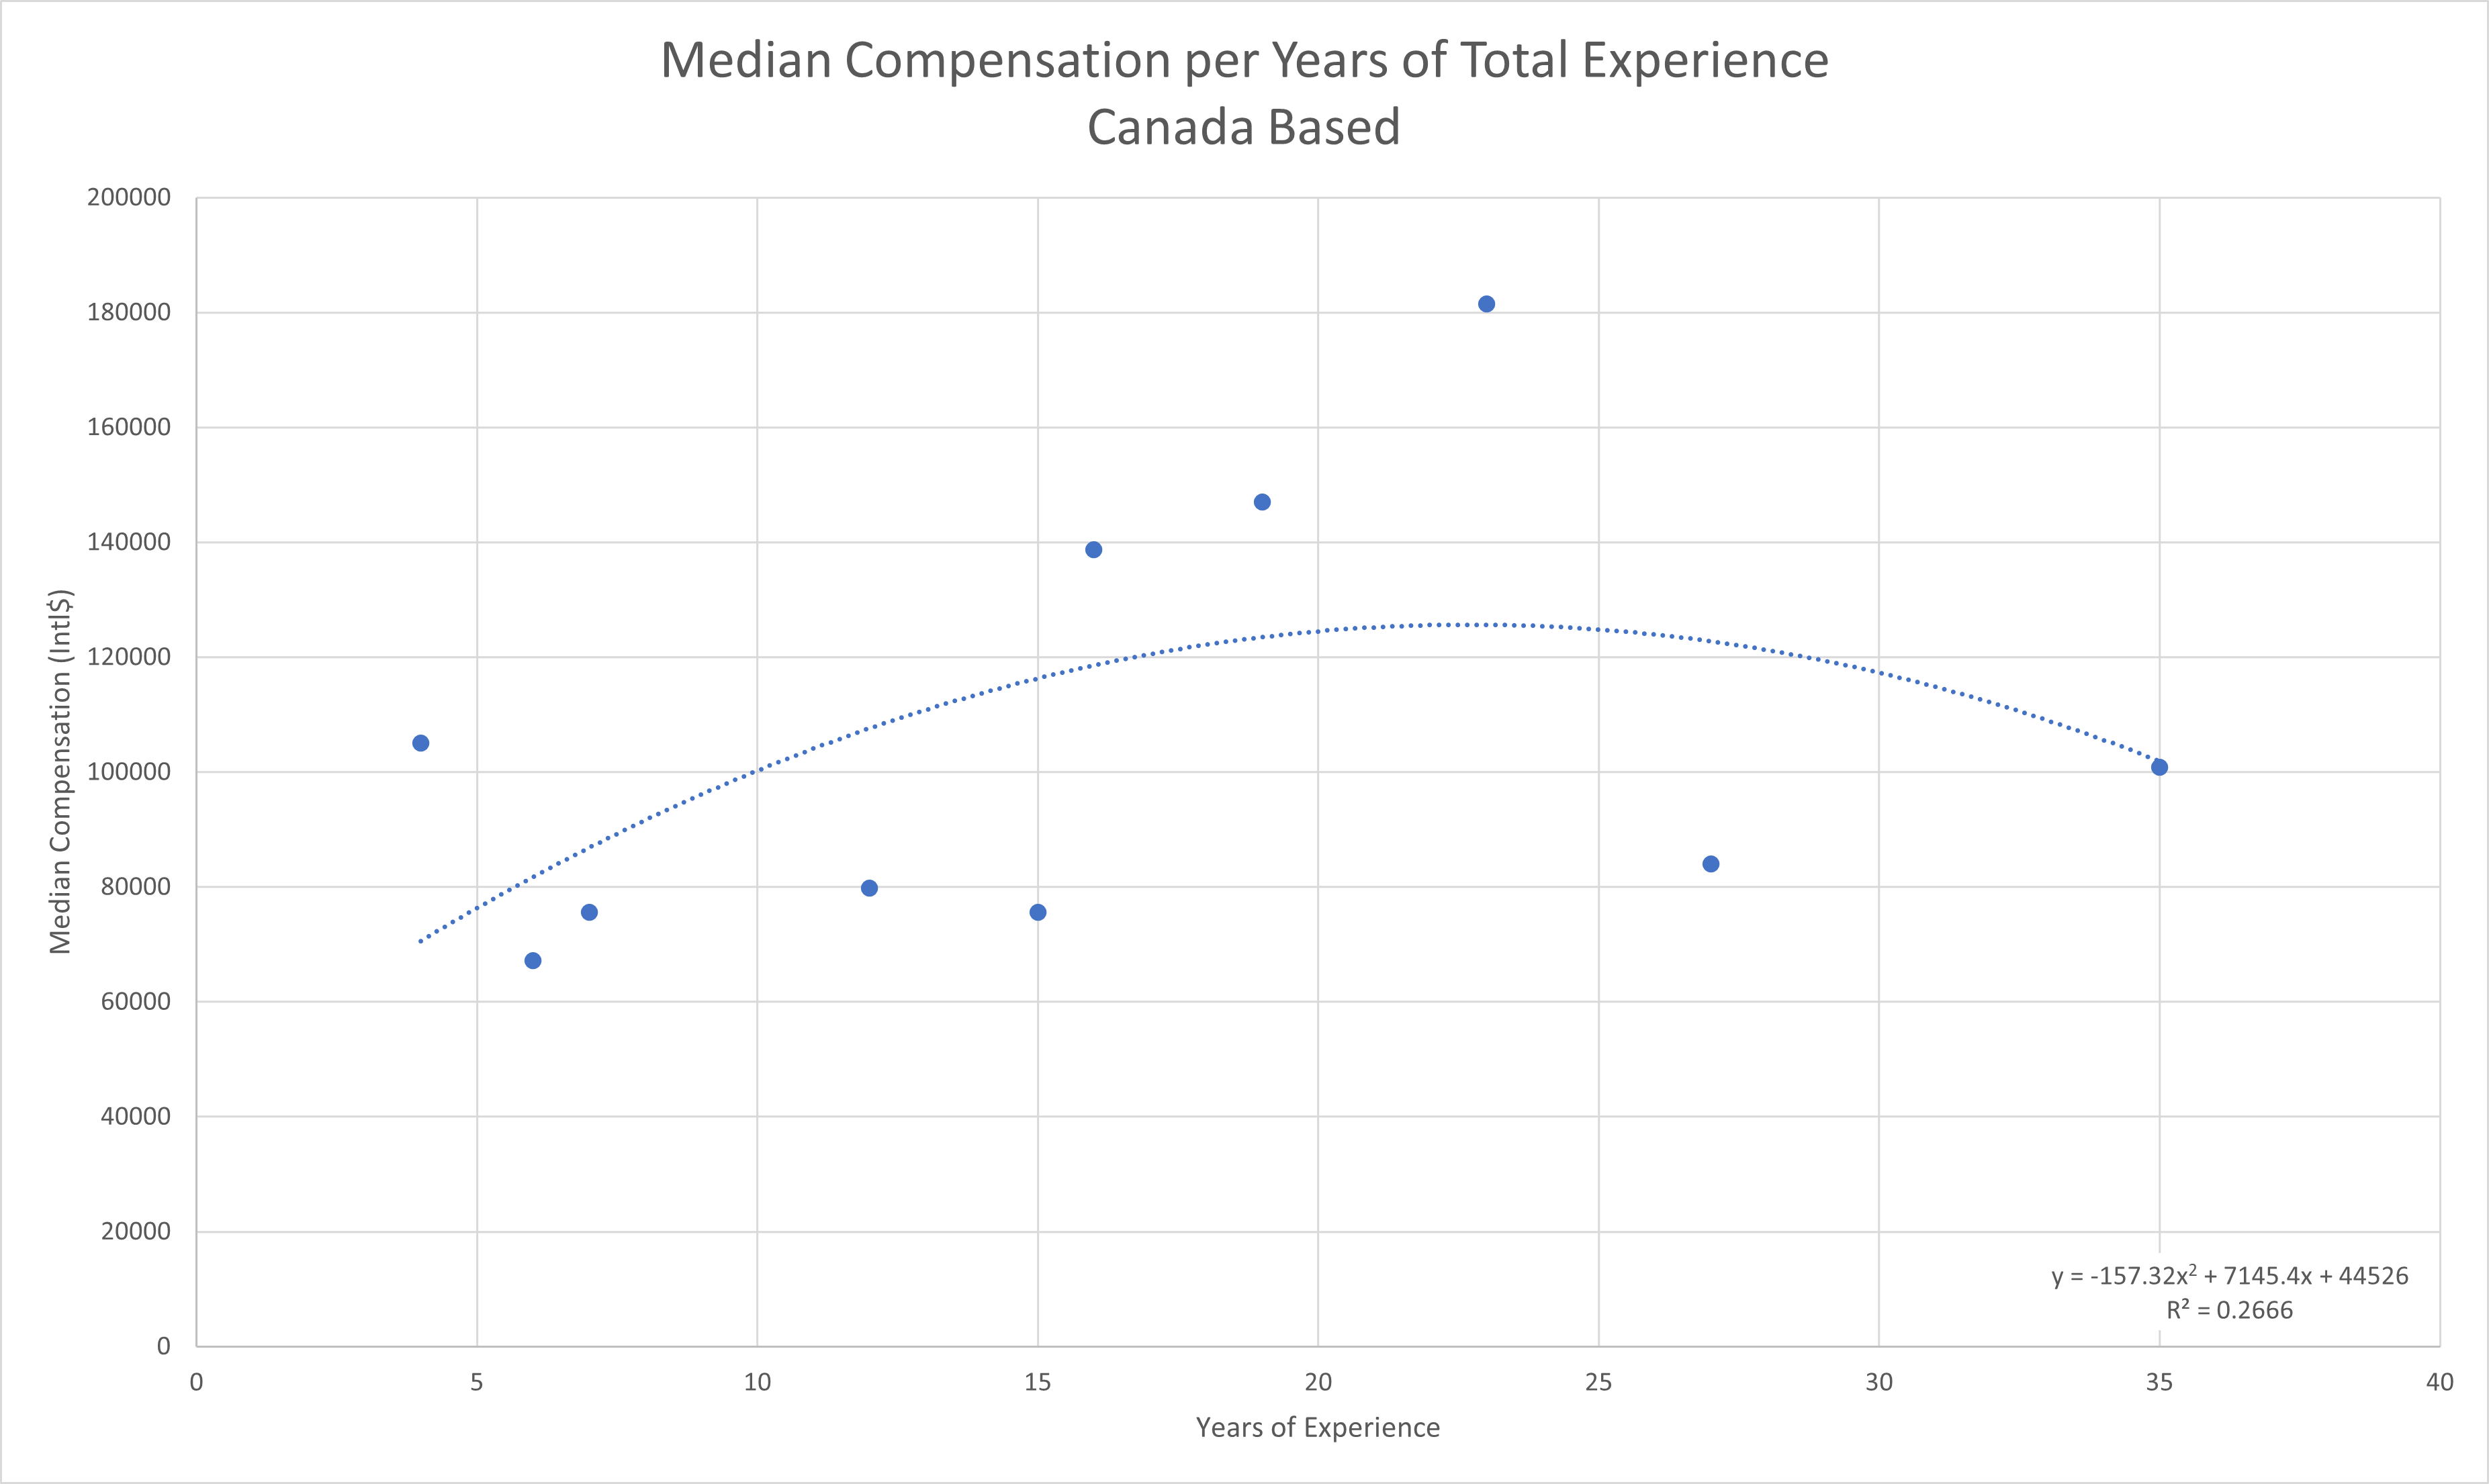
| Years | Median Compensation |
|---|---|
| 4 | 105,042 |
| 6 | 67,227 |
| 7 | 75,630 |
| 12 | 79,832 |
| 15 | 75,630 |
| 16 | 138,655 |
| 19 | 147,059 |
| 23 | 181,513 |
| 27 | 84,034 |
| 35 | 100,840 |
India Based
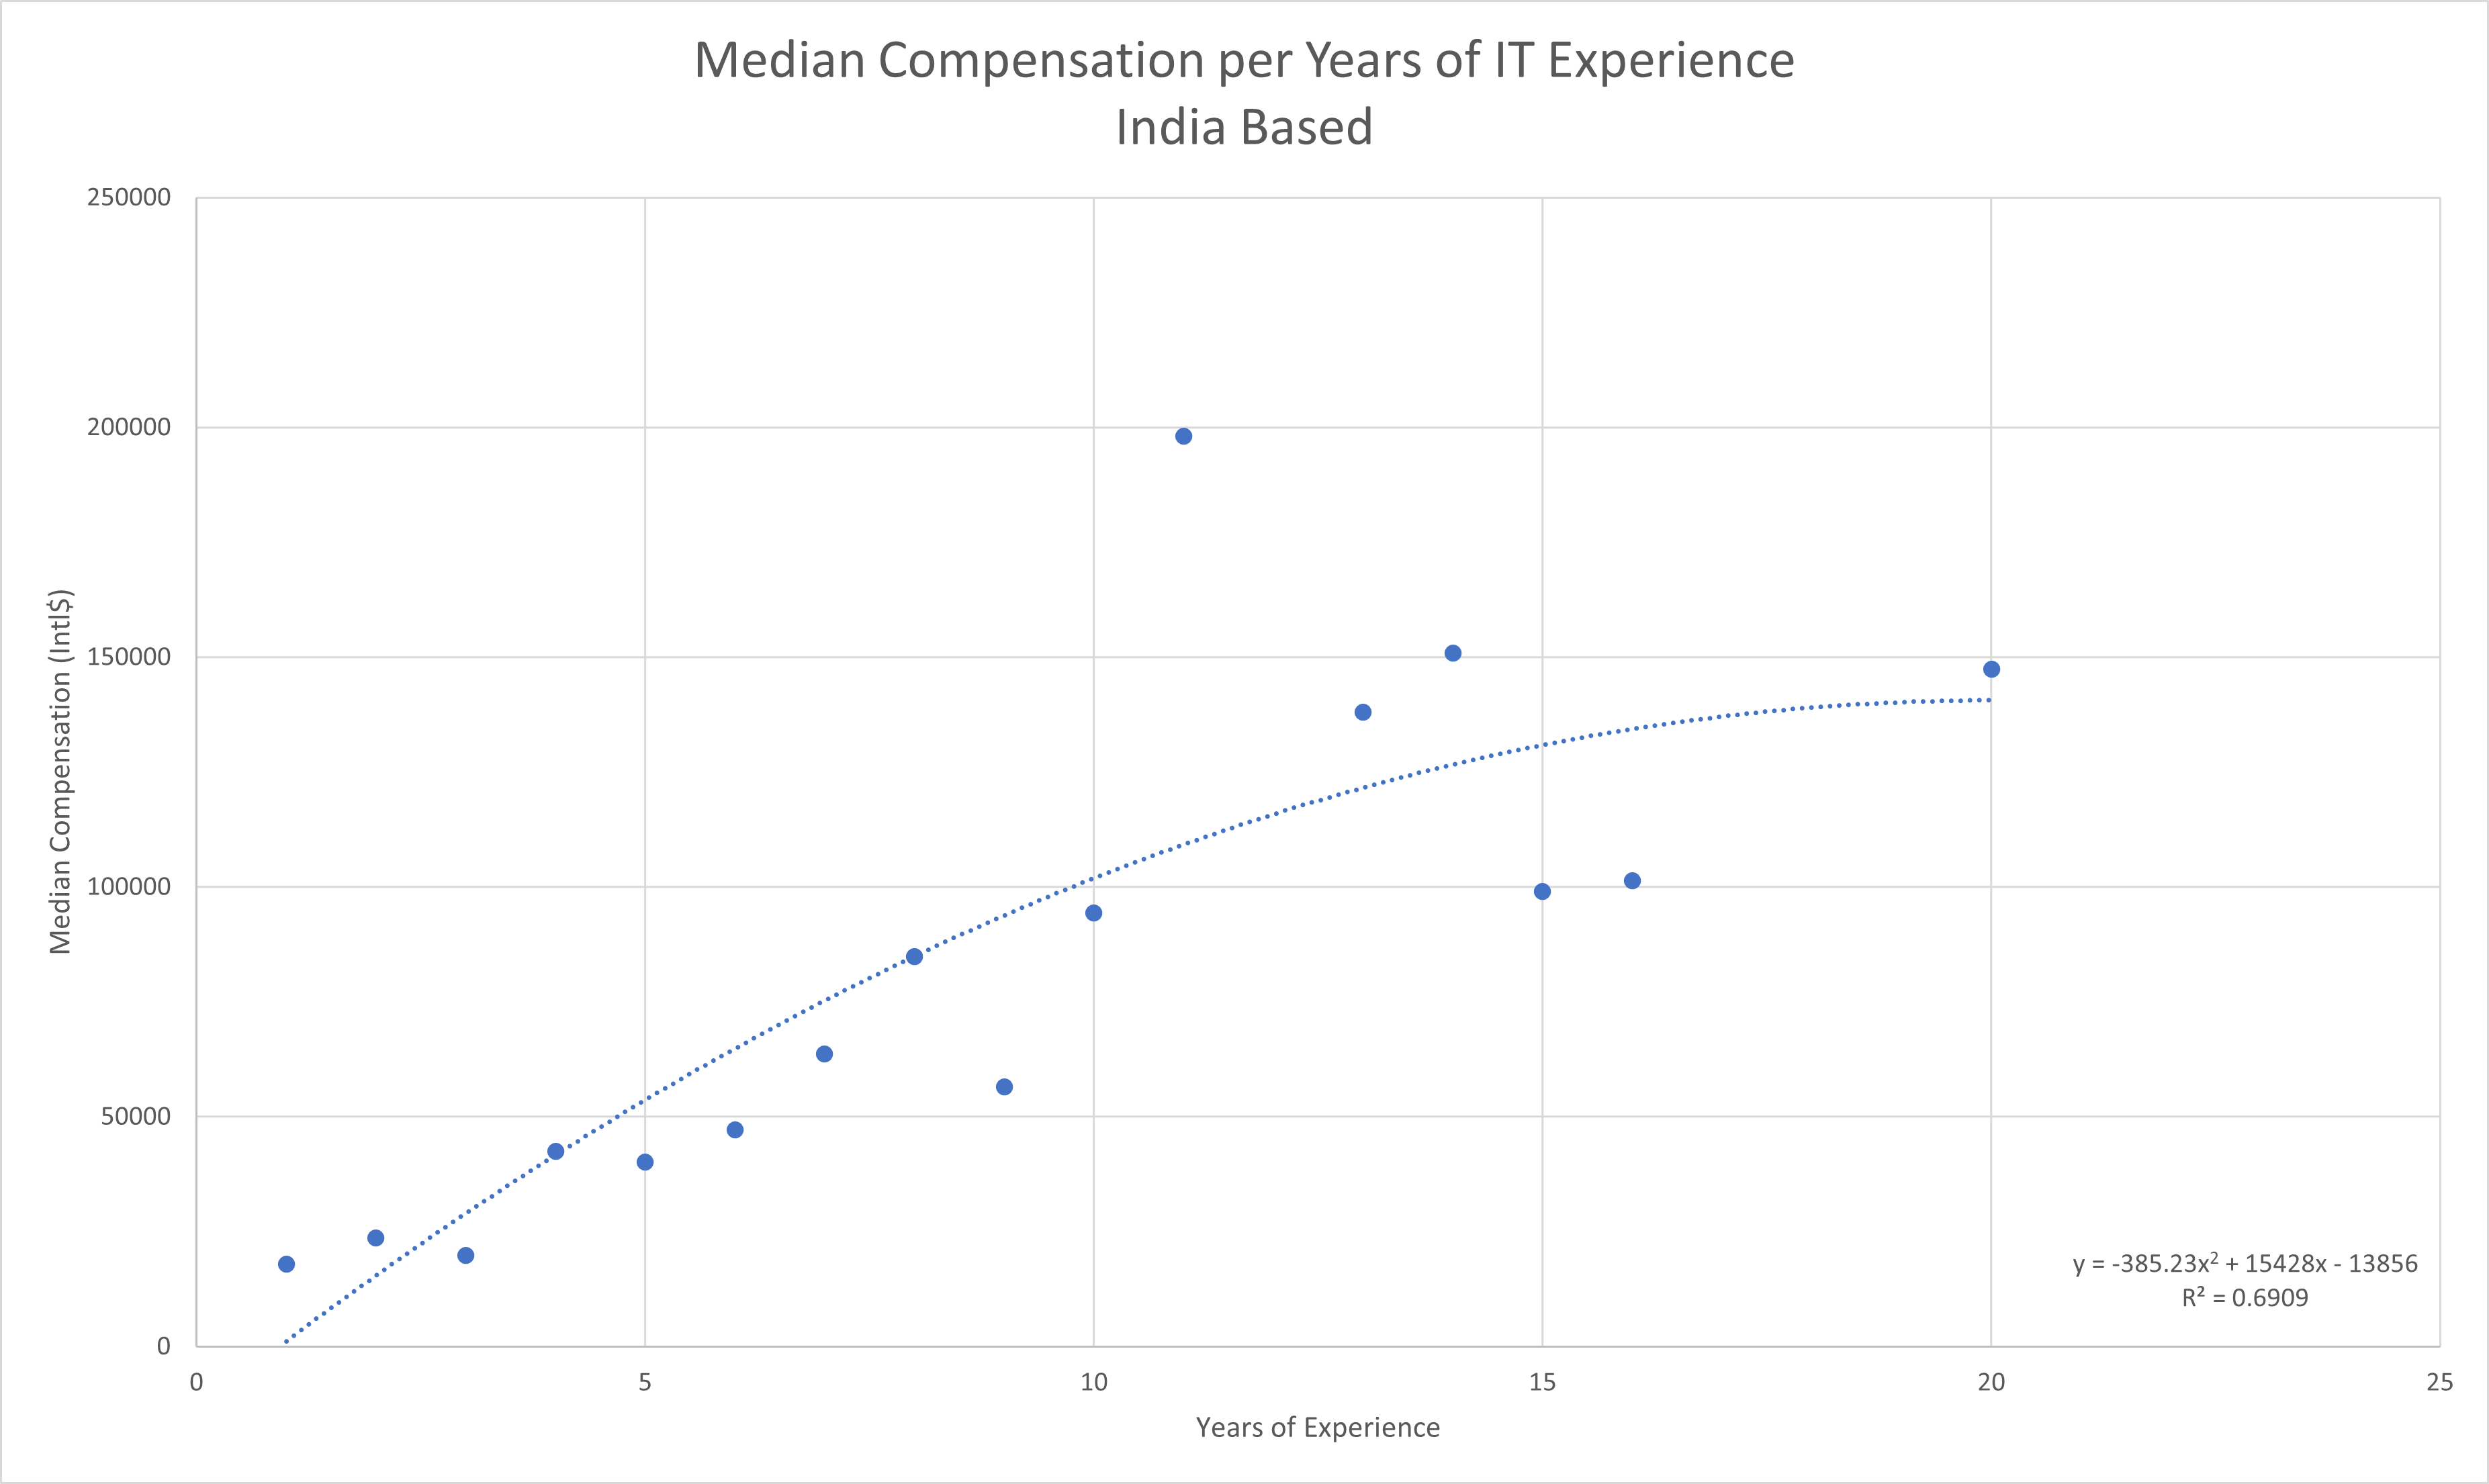
| Years | Median Compensation |
|---|---|
| 1 | 17,916 |
| 2 | 23,574 |
| 3 | 19,802 |
| 4 | 42,433 |
| 5 | 40,075 |
| 6 | 47,148 |
| 7 | 63,649 |
| 8 | 84,866 |
| 9 | 56,577 |
| 10 | 94,295 |
| 11 | 198,020 |
| 13 | 138,072 |
| 14 | 150,872 |
| 15 | 99,010 |
| 16 | 101,367 |
| 20 | 147,336 |
United Kingdom Based
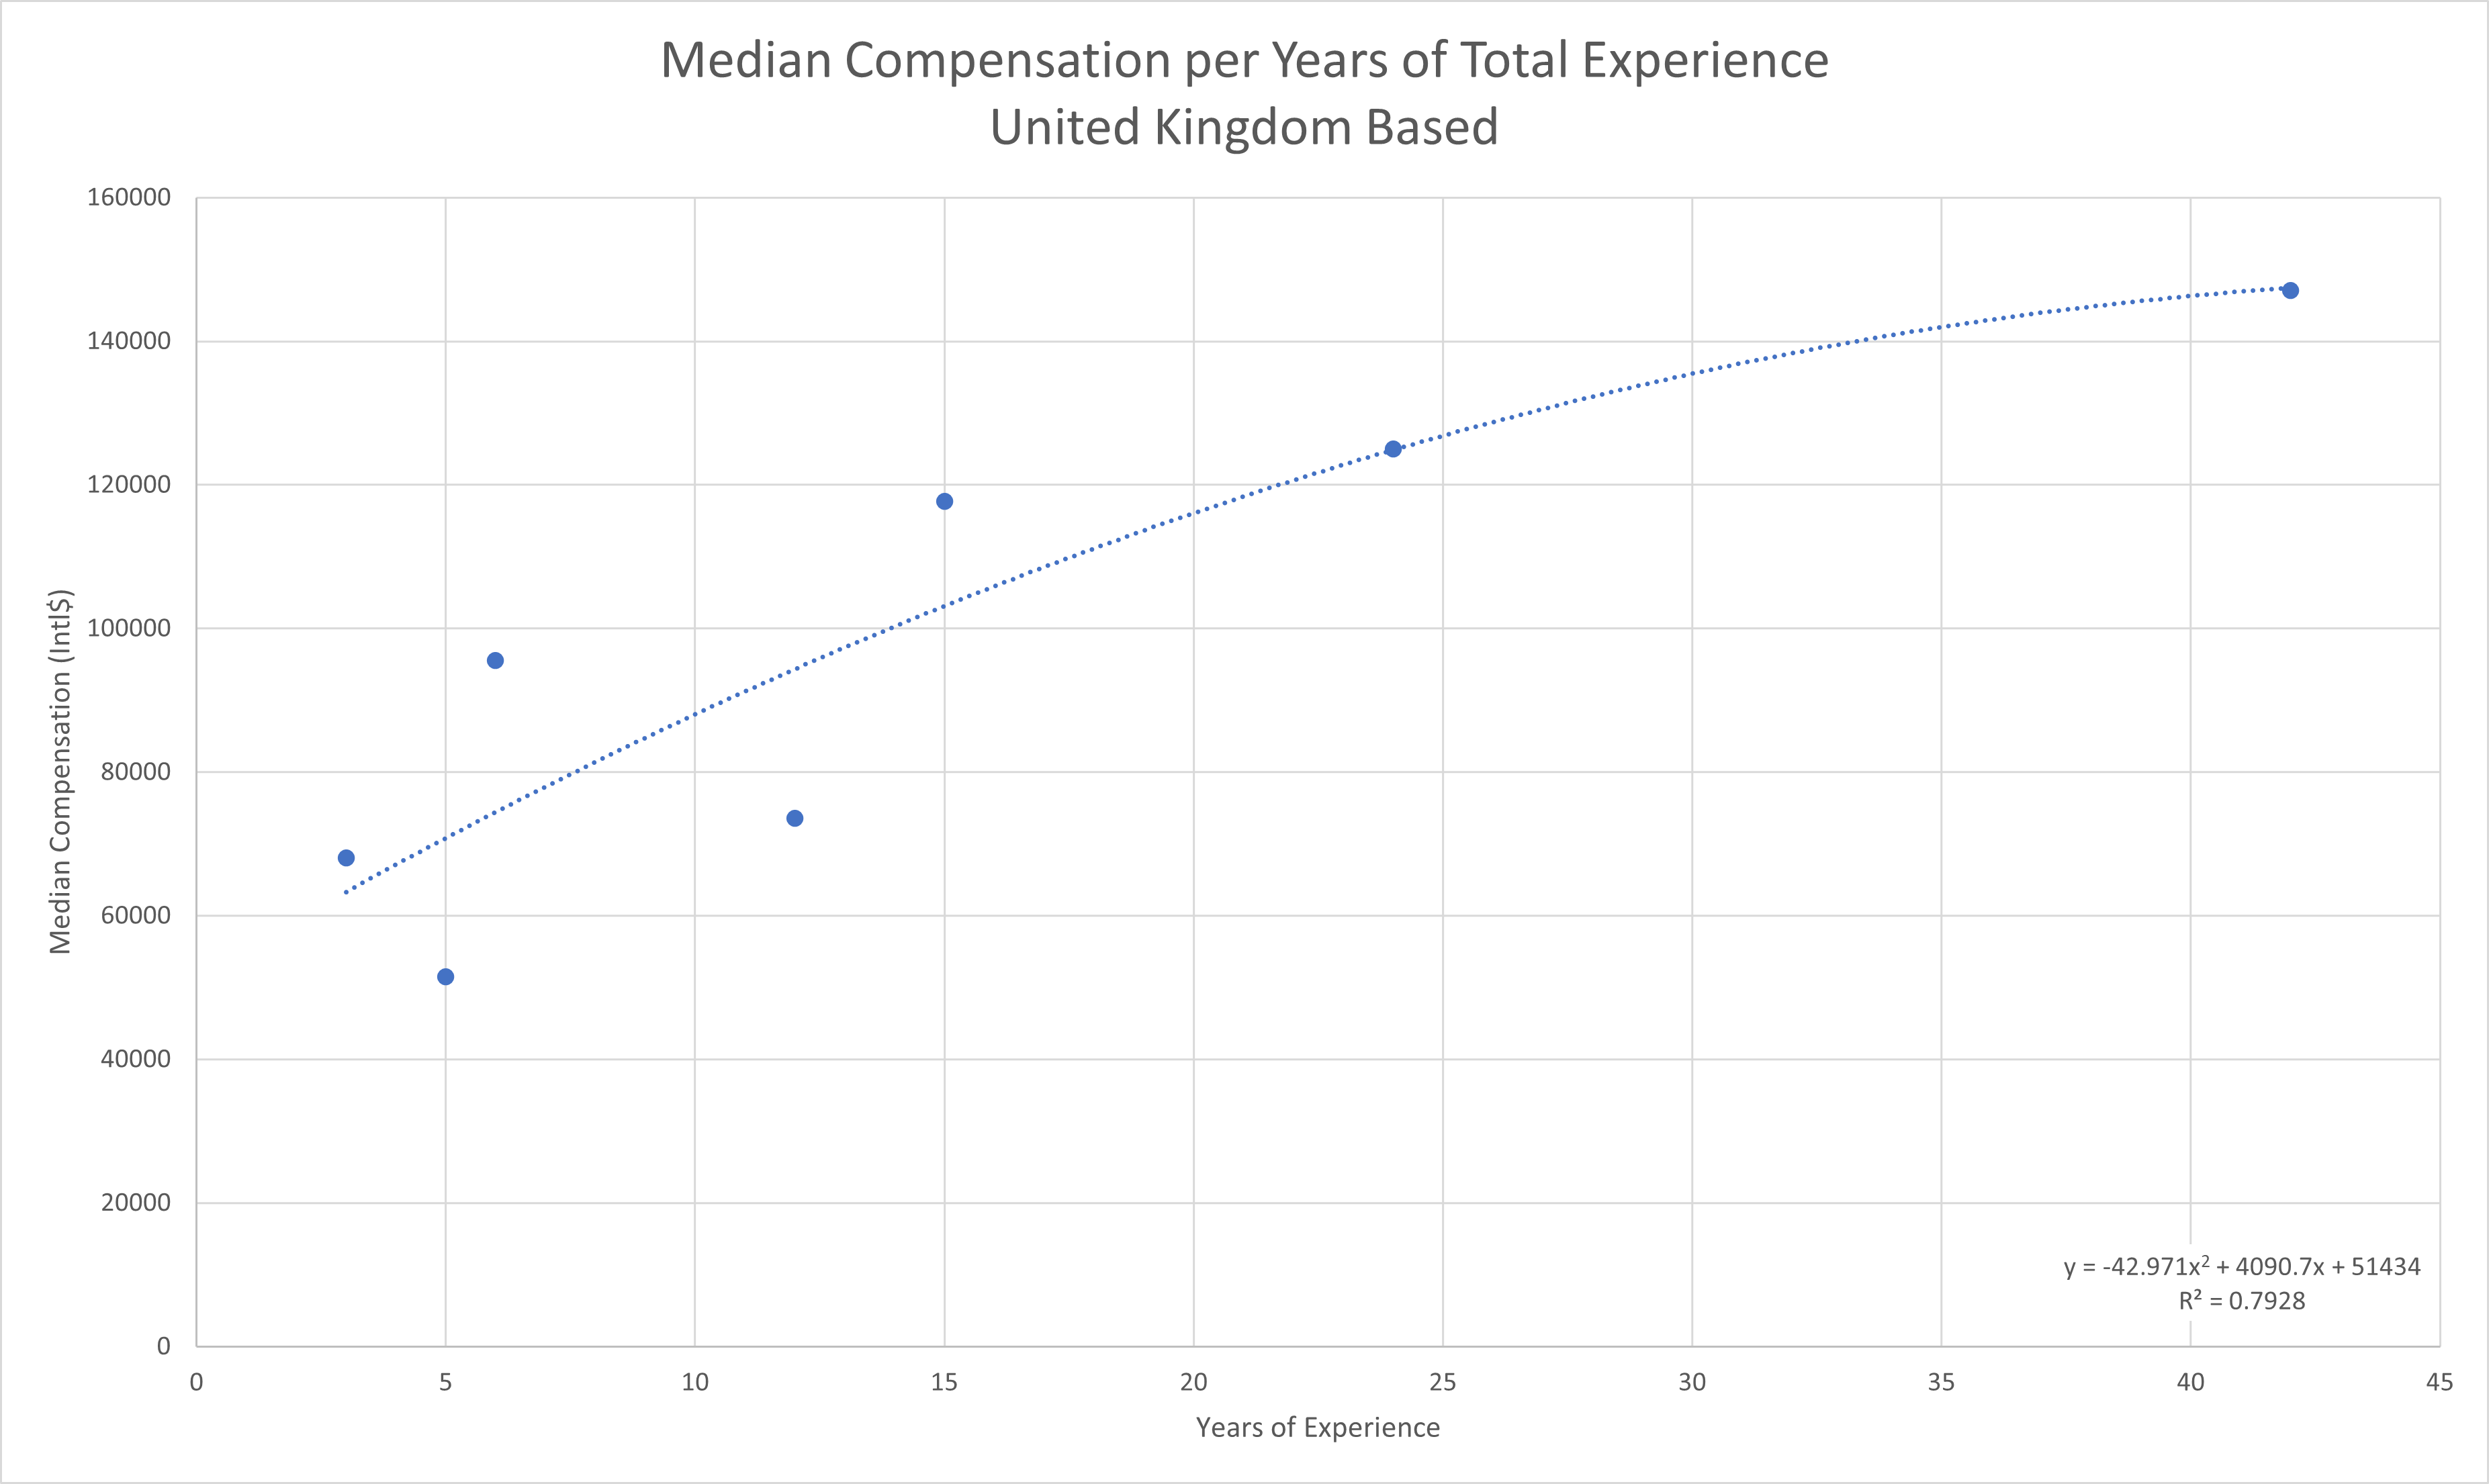
| Years | Median Compensation |
|---|---|
| 3 | 68,014 |
| 5 | 51,471 |
| 6 | 95,588 |
| 12 | 73,529 |
| 15 | 117,666 |
| 24 | 125,000 |
| 42 | 147,059 |
United States Based - Low Risk Pay Group
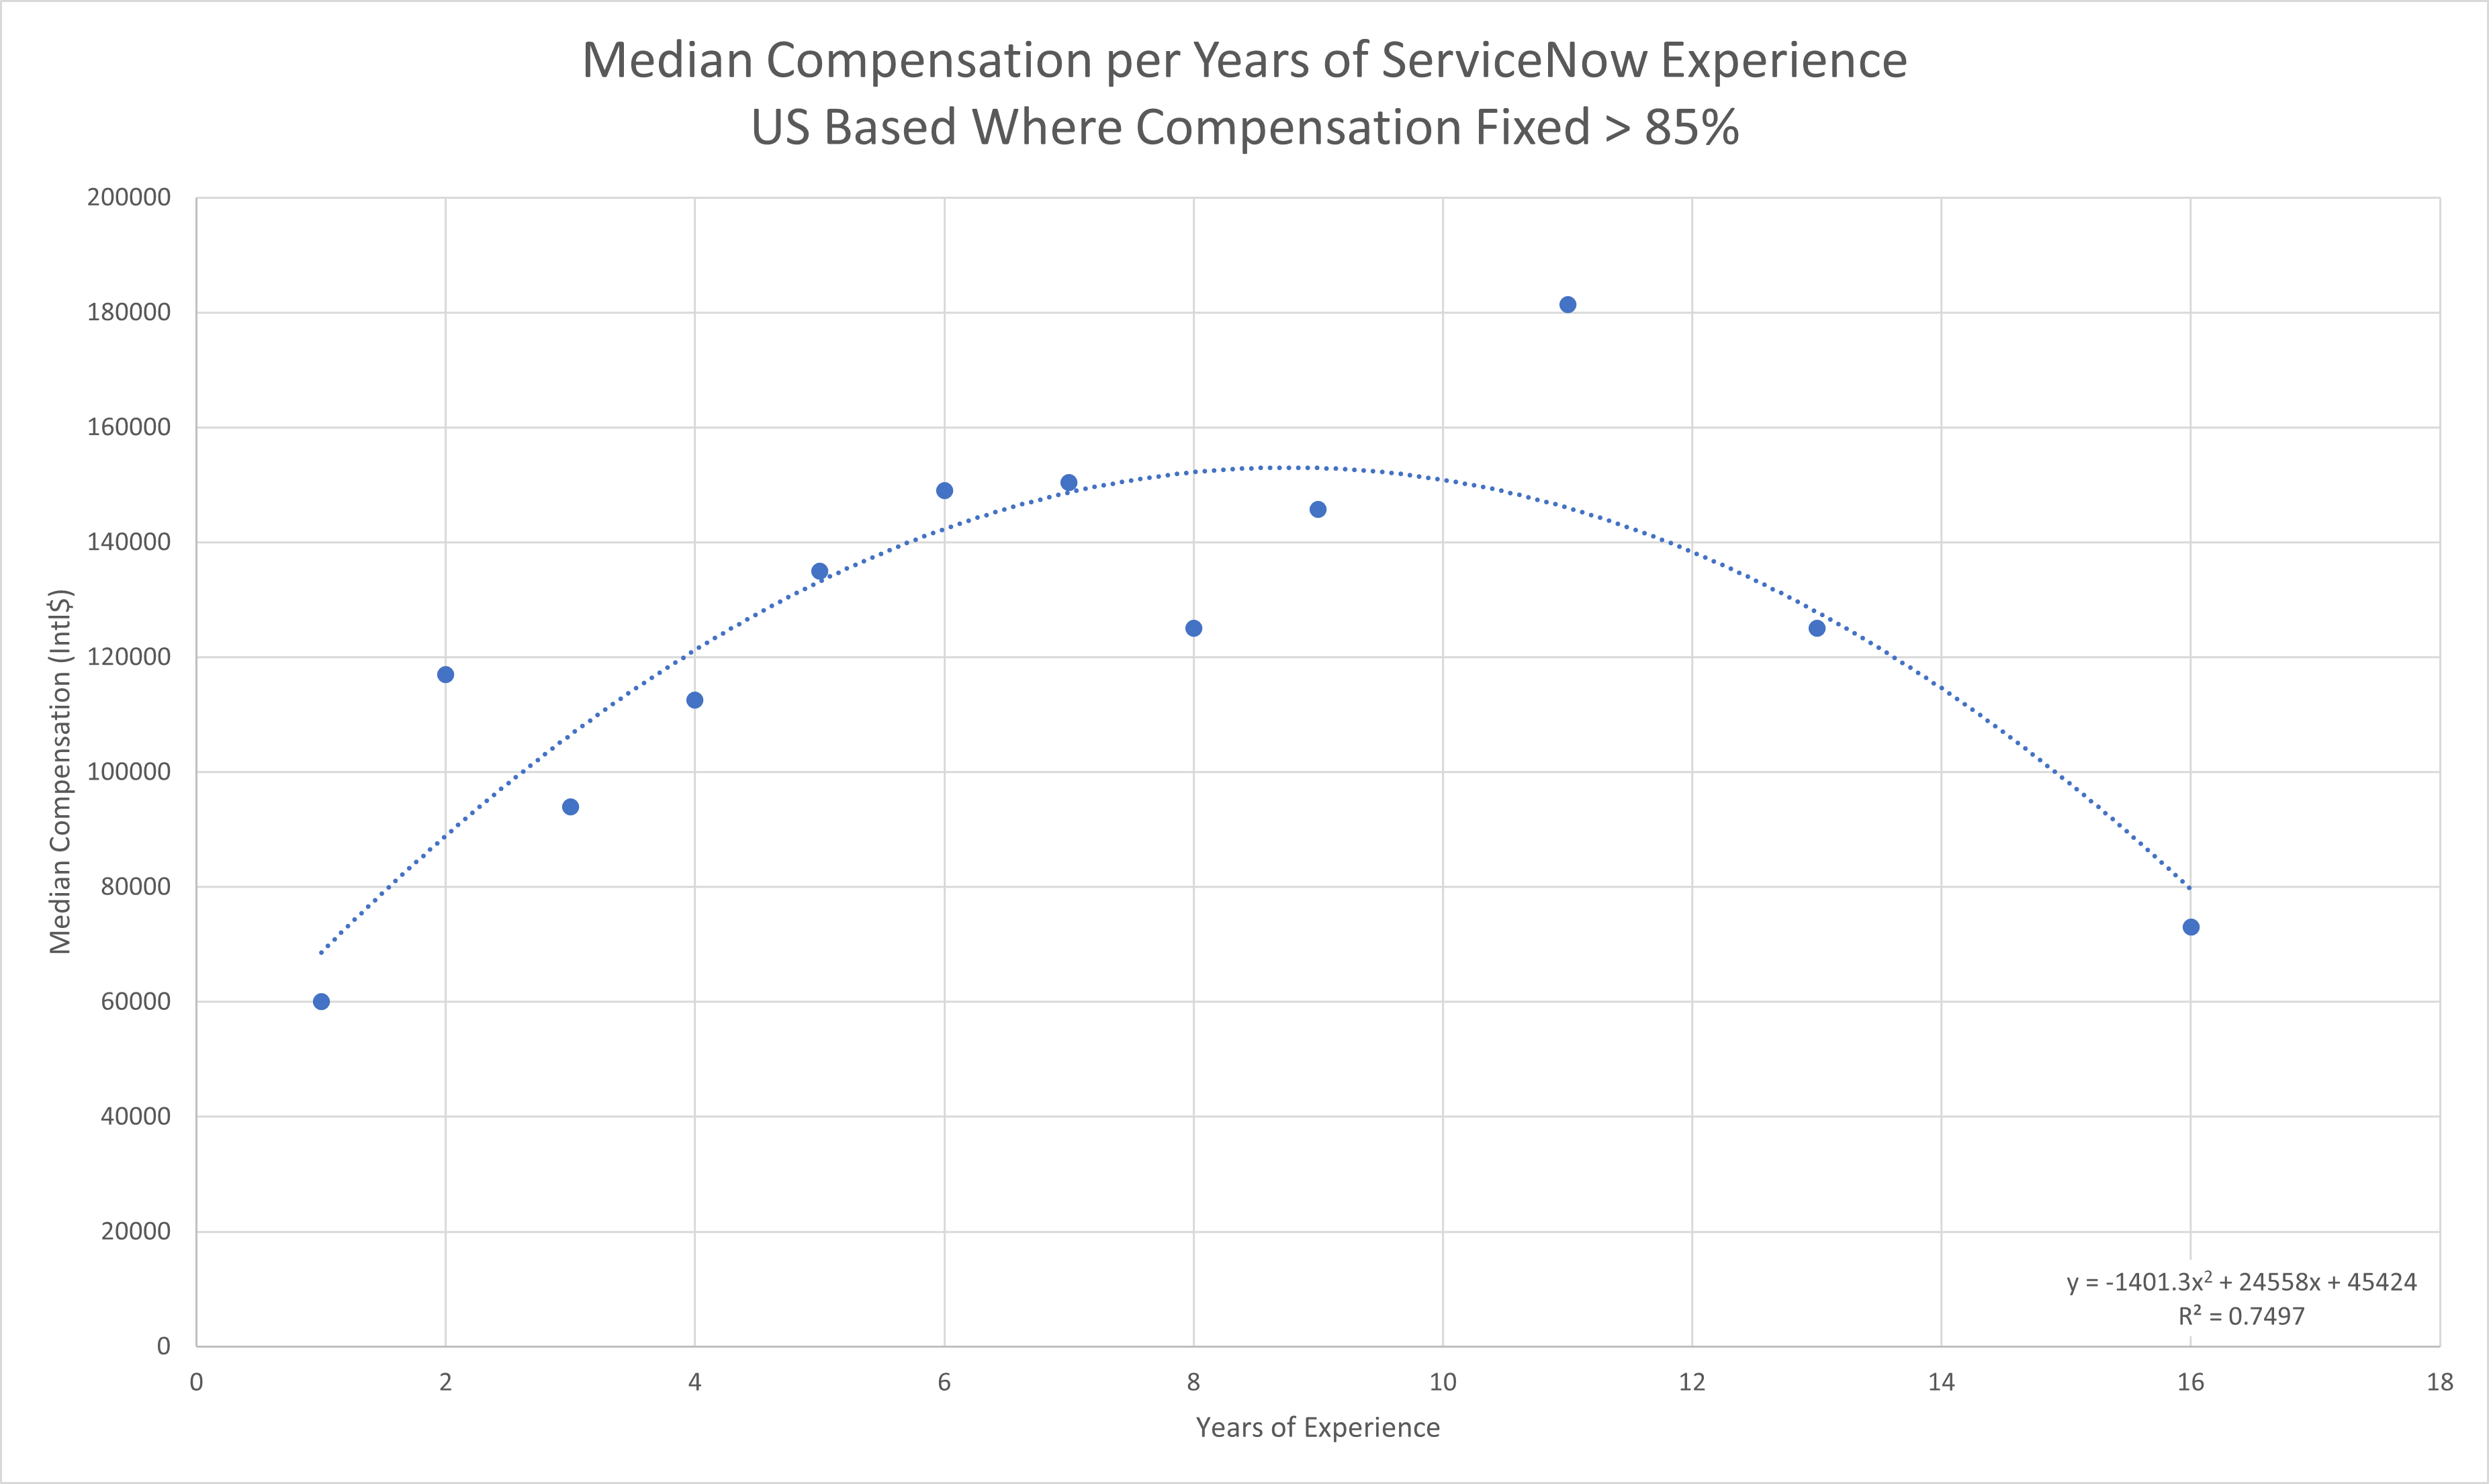
| Years | Median Compensation |
|---|---|
| 1 | 60,000 |
| 2 | 117,027 |
| 3 | 94,000 |
| 4 | 112,525 |
| 5 | 135,000 |
| 6 | 149,000 |
| 7 | 150,350 |
| 8 | 125,000 |
| 9 | 145,750 |
| 11 | 181,400 |
| 13 | 125,000 |
| 16 | 73,000 |
United States Based - High Risk Pay Group
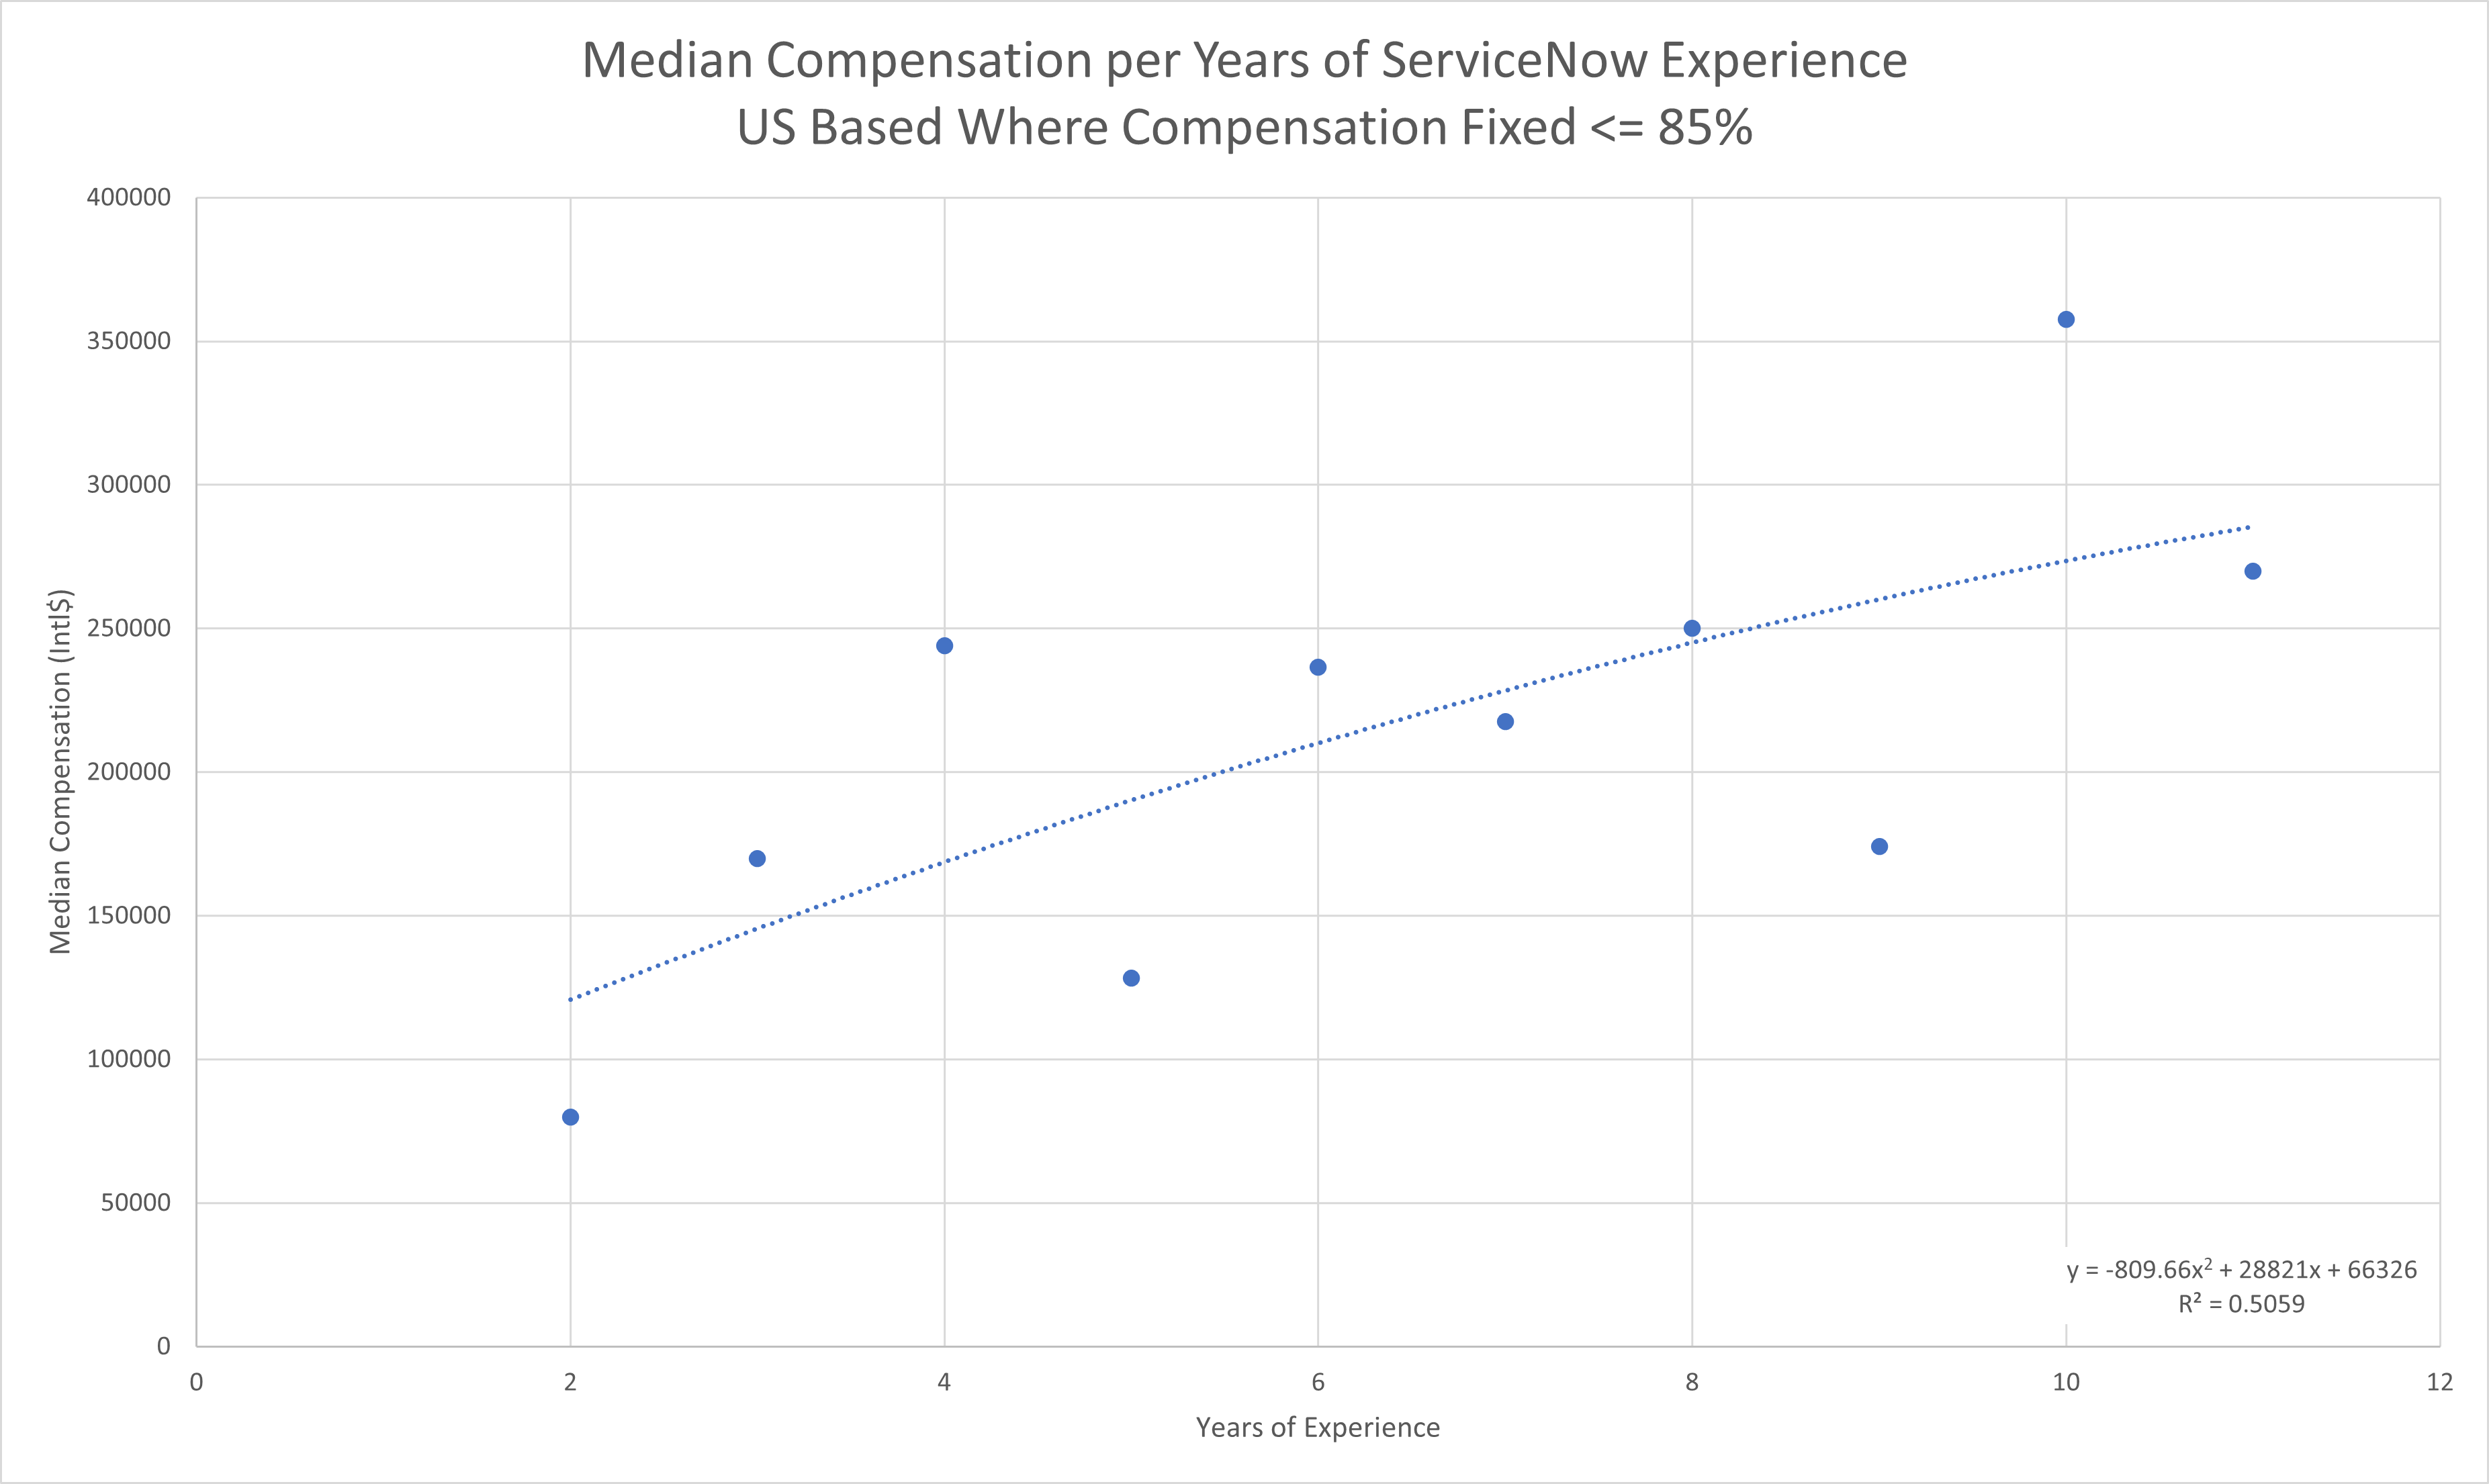
| Years | Median Compensation |
|---|---|
| 2 | 80,000 |
| 3 | 170,000 |
| 4 | 244,000 |
| 5 | 128,250 |
| 6 | 236,500 |
| 7 | 217,500 |
| 8 | 250,000 |
| 9 | 174,000 |
| 10 | 357,500 |
| 11 | 270,000 |
