Certifications

Compensation by Certification When Compared To Median Compensation of Individual's Peer Group
Below Median At Median Above Median
Survey Population 39.13% 21.30% 39.57%
Certified System Administrator 40.10% 19.80% 40.10%
CIS - IT Service Management 35.23% 15.91% 48.86%
Certified Application Developer 31.82% 19.70% 48.48%
CIS - Discovery 33.33% 23.33% 43.33%
CIS - Human Resources 25.00% 20.83% 54.17%
CIS - Customer Service Management 30.43% 13.04% 56.52%
CIS - Event Management 47.83% 13.04% 39.13%
CIS - Project Portfolio Management 41.18% 29.41% 29.41%
CIS - Application Portfolio Management 27.27% 36.36% 36.36%
CIS - Service Mapping 36.36% 27.27% 36.36%
CIS - Software Asset Management 40.00% 30.00% 30.00%
CIS - Vulnerability Response 14.29% 28.57% 57.14%
CAS - Performance Analytics 50.00% 0.00% 50.00%
CIS - Security Incident Response 0.00% 16.67% 83.33%
CIS - Risk and Compliance 50.00% 0.00% 50.00%
Certified Master Architect 33.33% 33.33% 33.33%
CIS - Cloud Management 33.33% 0.00% 66.67%
CIS - Field Service Management 0.00% 100.00% 0.00%
CIS - Vendor Risk Management 0.00% 0.00% 100.00%
Compensation by Lack of Certification When Compared To Median Compensation of Individual's Peer Group
Below Median At Median Above Median
Survey Population 39.13% 21.30% 39.57%
CIS - IT Service Management 41.55% 24.65% 33.80%
Certified System Administrator 32.14% 32.14% 35.71%
Certified Application Developer 42.07% 21.95% 35.98%
CIS - Customer Service Management 40.10% 22.22% 37.68%
CIS - Human Resources 40.78% 21.36% 37.86%
CIS - Security Incident Response 40.18% 21.43% 38.39%
CIS - Discovery 40.00% 21.00% 39.00%
CIS - Vulnerability Response 39.91% 21.08% 39.01%
CIS - Cloud Management 39.21% 21.59% 39.21%
CAS - Performance Analytics 38.84% 21.88% 39.29%
CIS - Vendor Risk Management 39.30% 21.40% 39.30%
CIS - Risk and Compliance 38.94% 21.68% 39.38%
CIS - Event Management 38.16% 22.22% 39.61%
Certified Master Architect 39.21% 21.15% 39.65%
CIS - Service Mapping 39.27% 21.00% 39.73%
CIS - Application Portfolio Management 39.73% 20.55% 39.73%
CIS - Field Service Management 39.47% 20.61% 39.91%
CIS - Software Asset Management 39.09% 20.91% 40.00%
CIS - Project Portfolio Management 38.97% 20.66% 40.38%
Compensation by Total CIS Certifications When Compared To Median Compensation of Individual's Peer Group
Below Median At Median Above Median
Survey Population 39.13% 21.30% 39.57%
< 4 Total CIS Certifications 40.38% 21.63% 37.98%
>= 4 Total CIS Certifications 27.27% 18.18% 54.55%

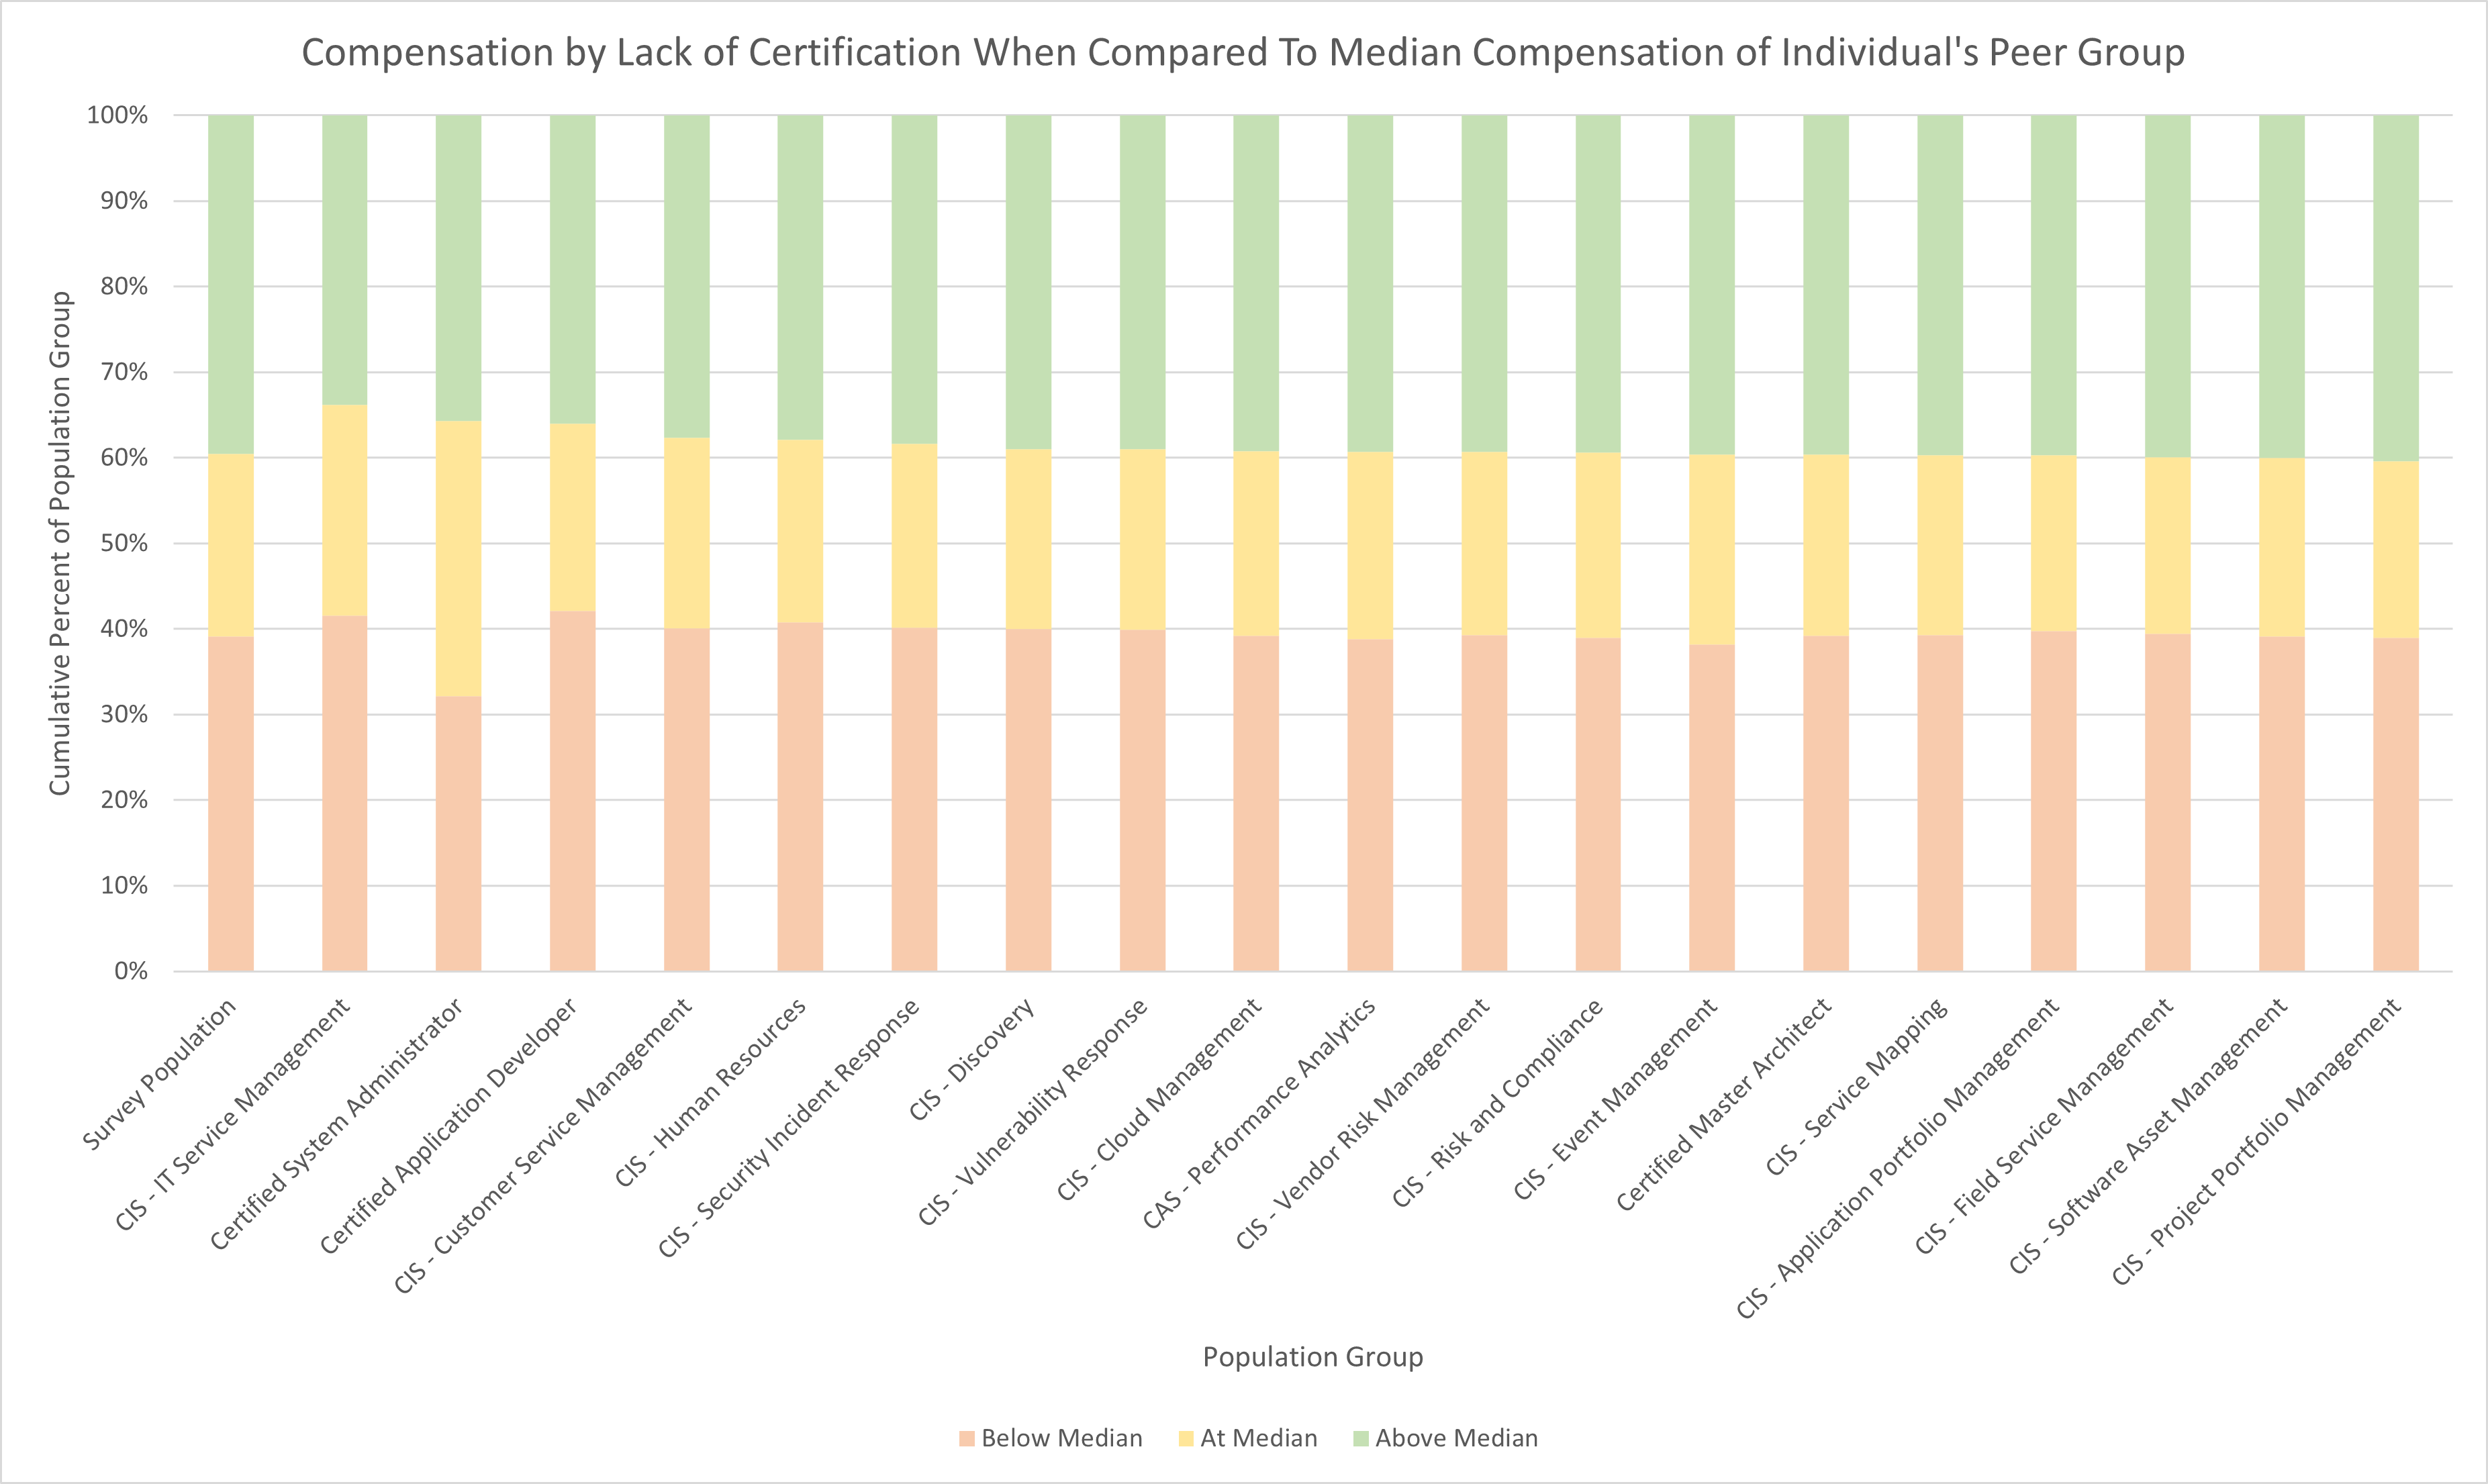
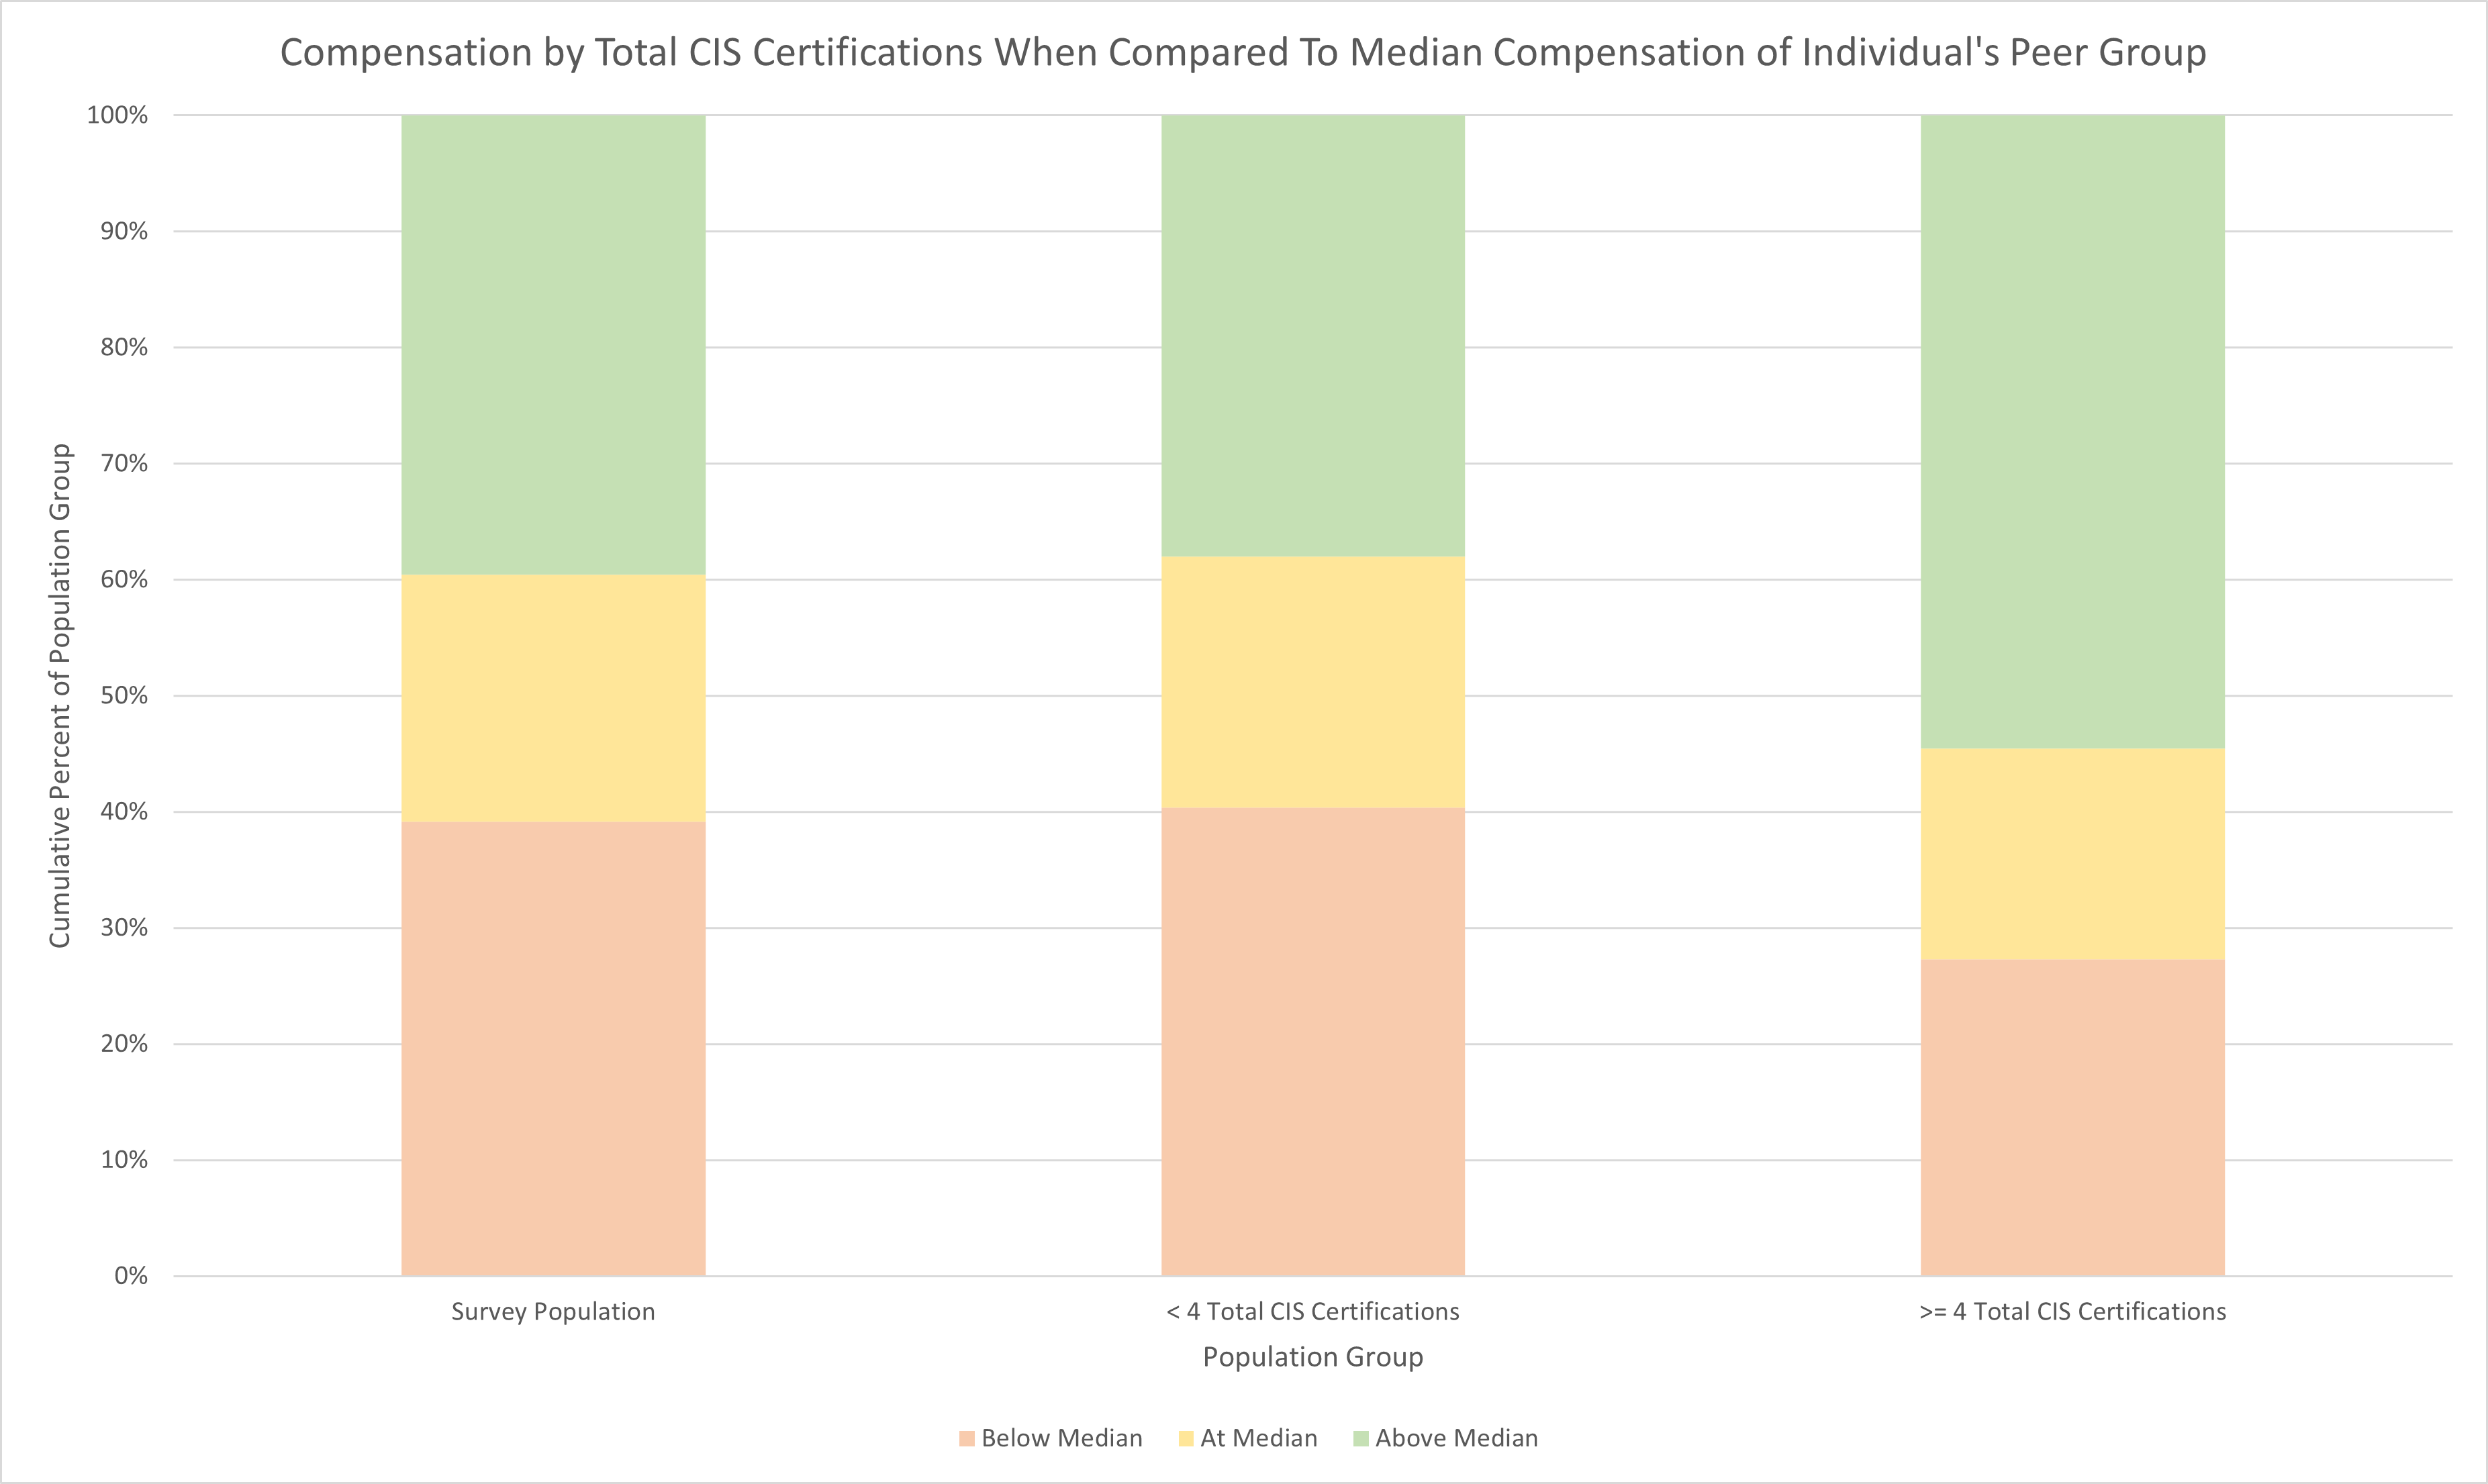
Overall, most certifications appear to have little influence on compensation. The top two ranked certifications in terms of influence were CIS IT Service Management and Certified Application Developer at 8th and 19th respectively. The ranking of certifications took into consideration both the influence of having the certification and the influence of not having the certification. For the two aforementioned certifications, the difference odds of being compensated above median value compared to one’s peers increased by about 13 percentage points. It is interesting to note that these are also the second and third most popular certifications. The popularity of the ITSM and CAS certifications appears to place them in the perfect position of relevance: rare enough to be of value but popular enough to be considered attainable by employers. The vast majority of certifications, however, have very low rankings with many appearing at the lowest importance ranks.

While some certifications do appear to have a strong individual importance such as CIS Vendor Management and CIS Cloud Management, their popularity limits the influence on the population as a whole. It is difficult to tell whether the individual influence trend on these certifications would continue if their popularity increased. Certainly, there is at least a level of saturation which when reached, such as the Certified System Administrator certification, where the value is reduced.

This should not be taken to mean that there is no value in most ServiceNow certifications. It is still possible, in fact probable, that certifications act as gatekeepers into specific peer groups. In a scenario where everyone in your peer group completed the same certifications, certifications would be expected to have a low influence on compensation.

College Education

Compensation by Degree Completed When Compared To Median Compensation of Individual's Peer Group
Below Median At Median Above Median
Survey Population 39.13% 21.30% 39.57%
Non-Technology Degree 36.36% 22.73% 40.91%
Technology Degree 39.43% 20.00% 40.57%
Did not attend college 40.00% 40.00% 20.00%
Prefer not to disclose 50.00% 33.33% 16.67%
Compensation by Education Level When Compared To Median Compensation of Individual's Peer Group
Below Median At Median Above Median
Survey Population 39.13% 21.30% 39.57%
High School Diploma, GCSEs or equivalent 50.00% 12.50% 37.50%
Some College 38.89% 27.78% 33.33%
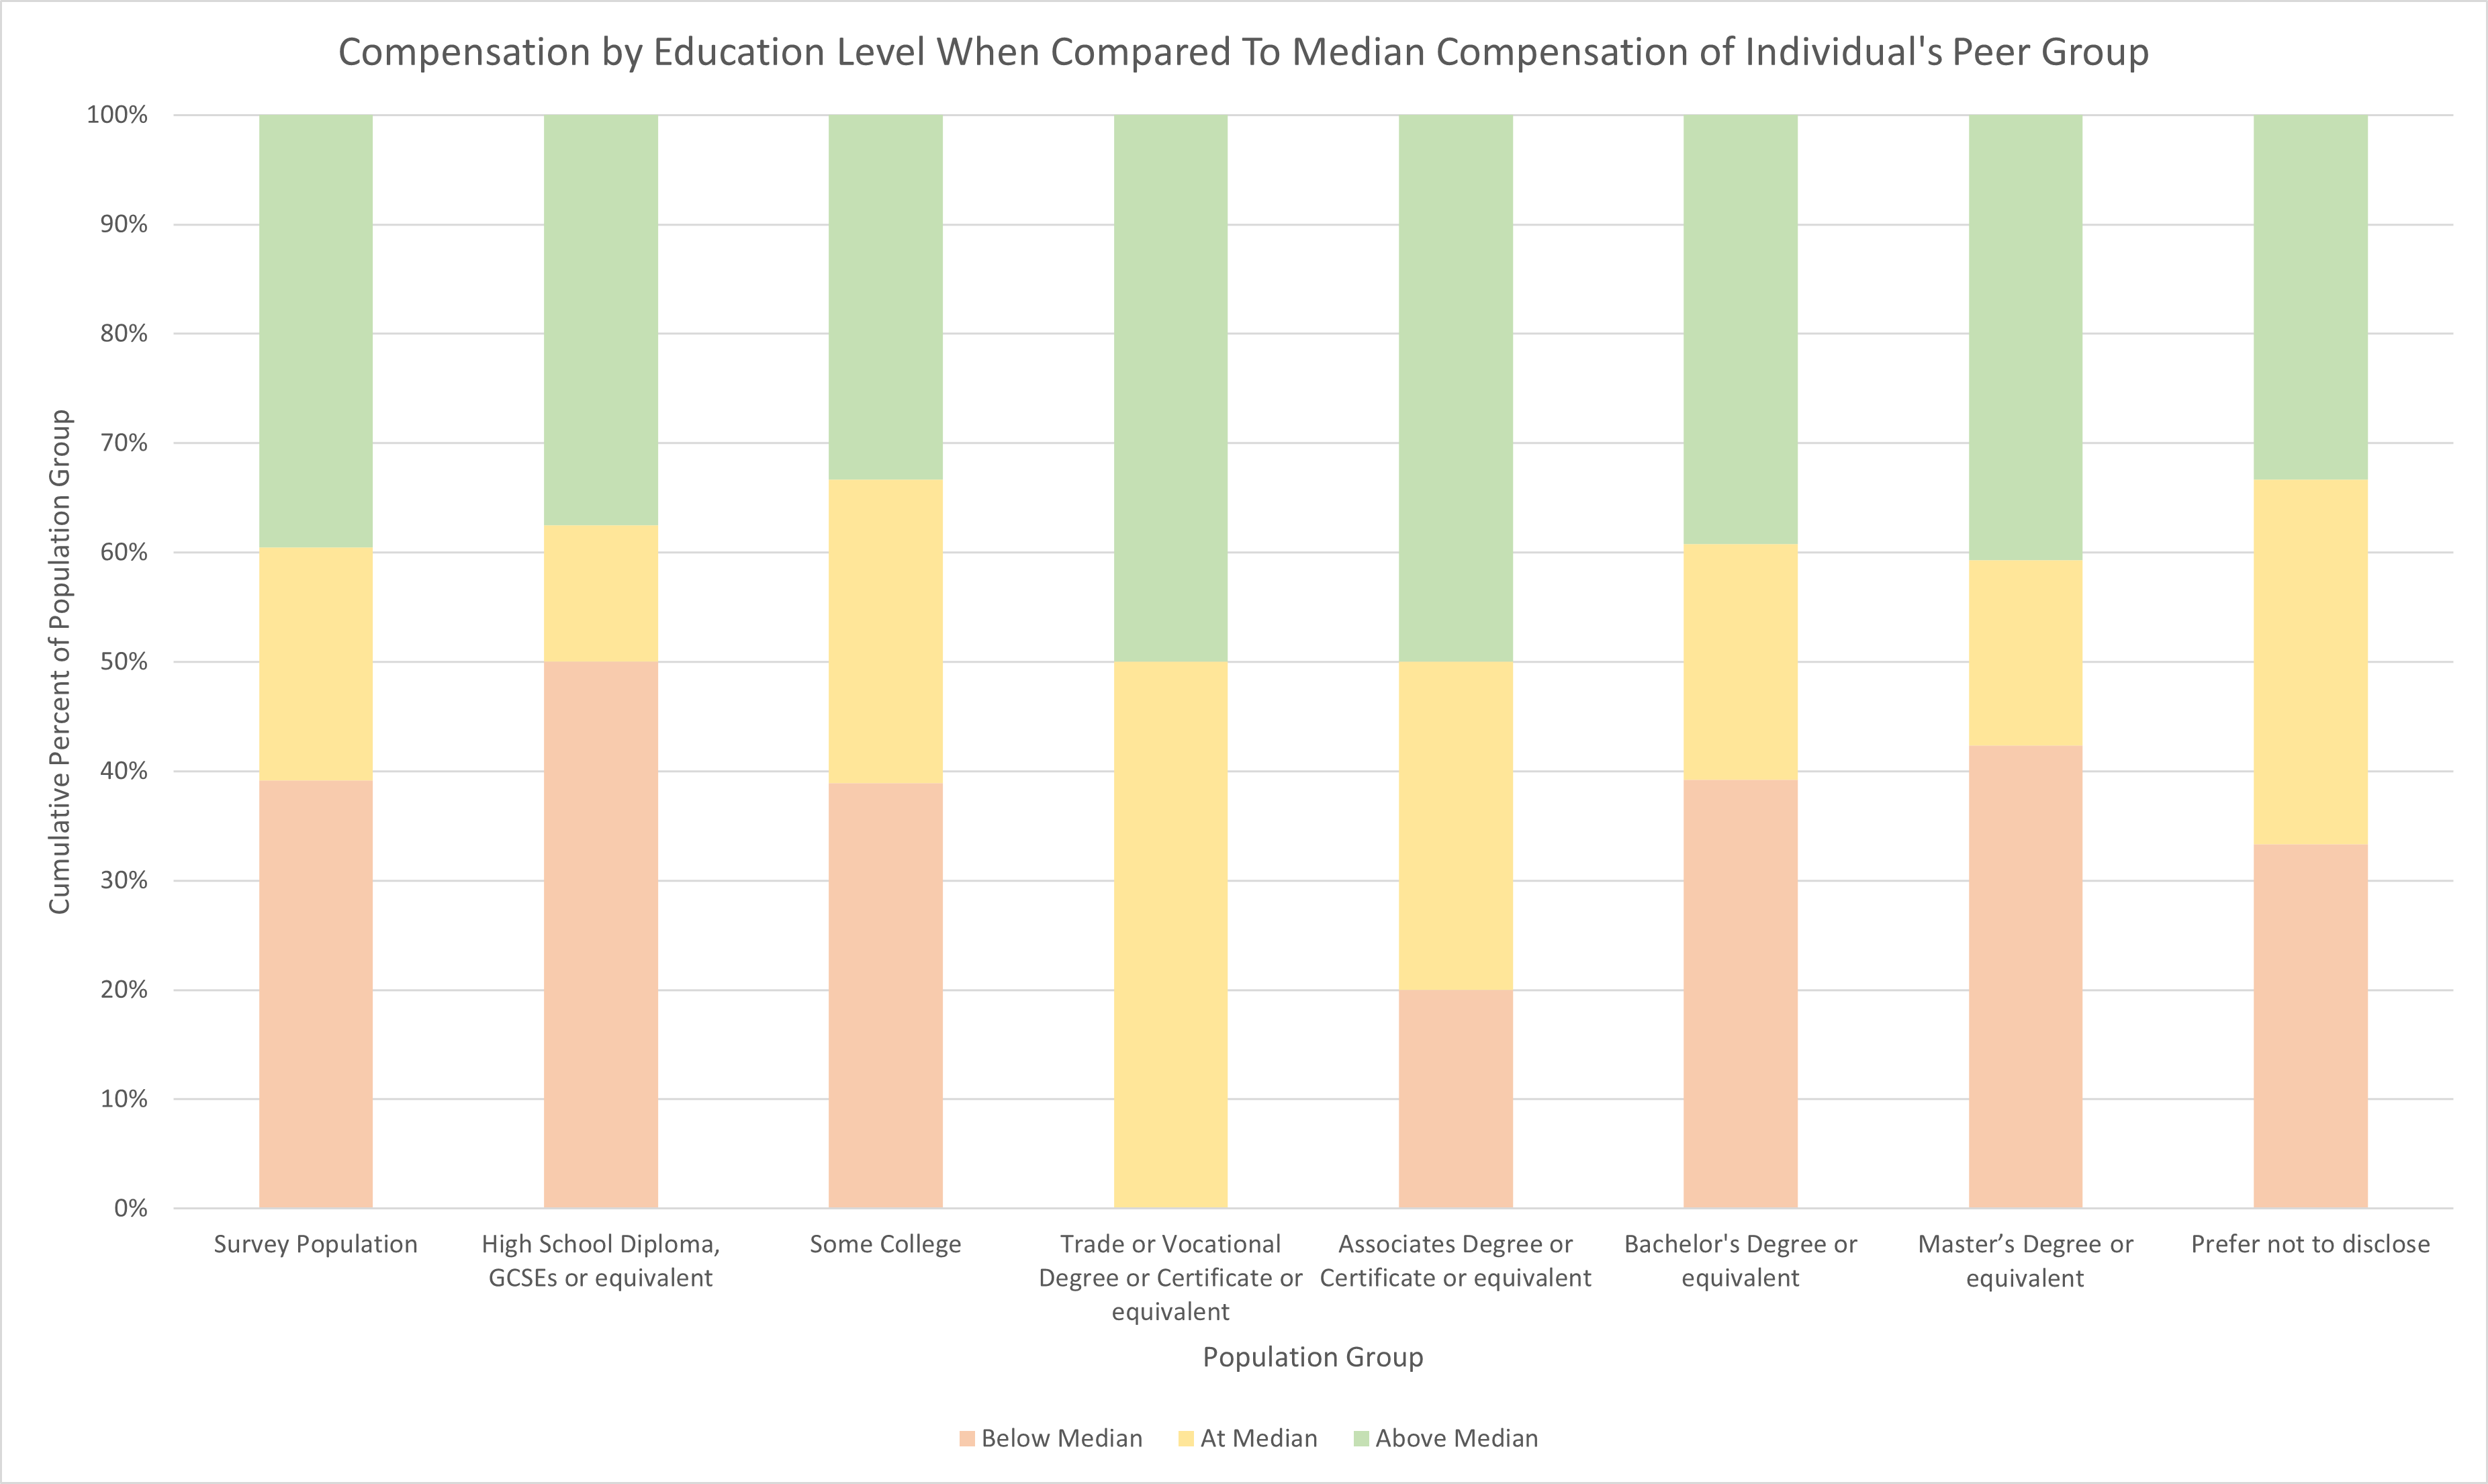
Trade or Vocational Degree or Certificate or equivalent 0.00% 50.00% 50.00%
Associates Degree or Certificate or equivalent 20.00% 30.00% 50.00%
Bachelor’s Degree or equivalent 39.23% 21.54% 39.23%
Master’s Degree or equivalent 42.37% 16.95% 40.68%
Prefer not to disclose 33.33% 33.33% 33.33%

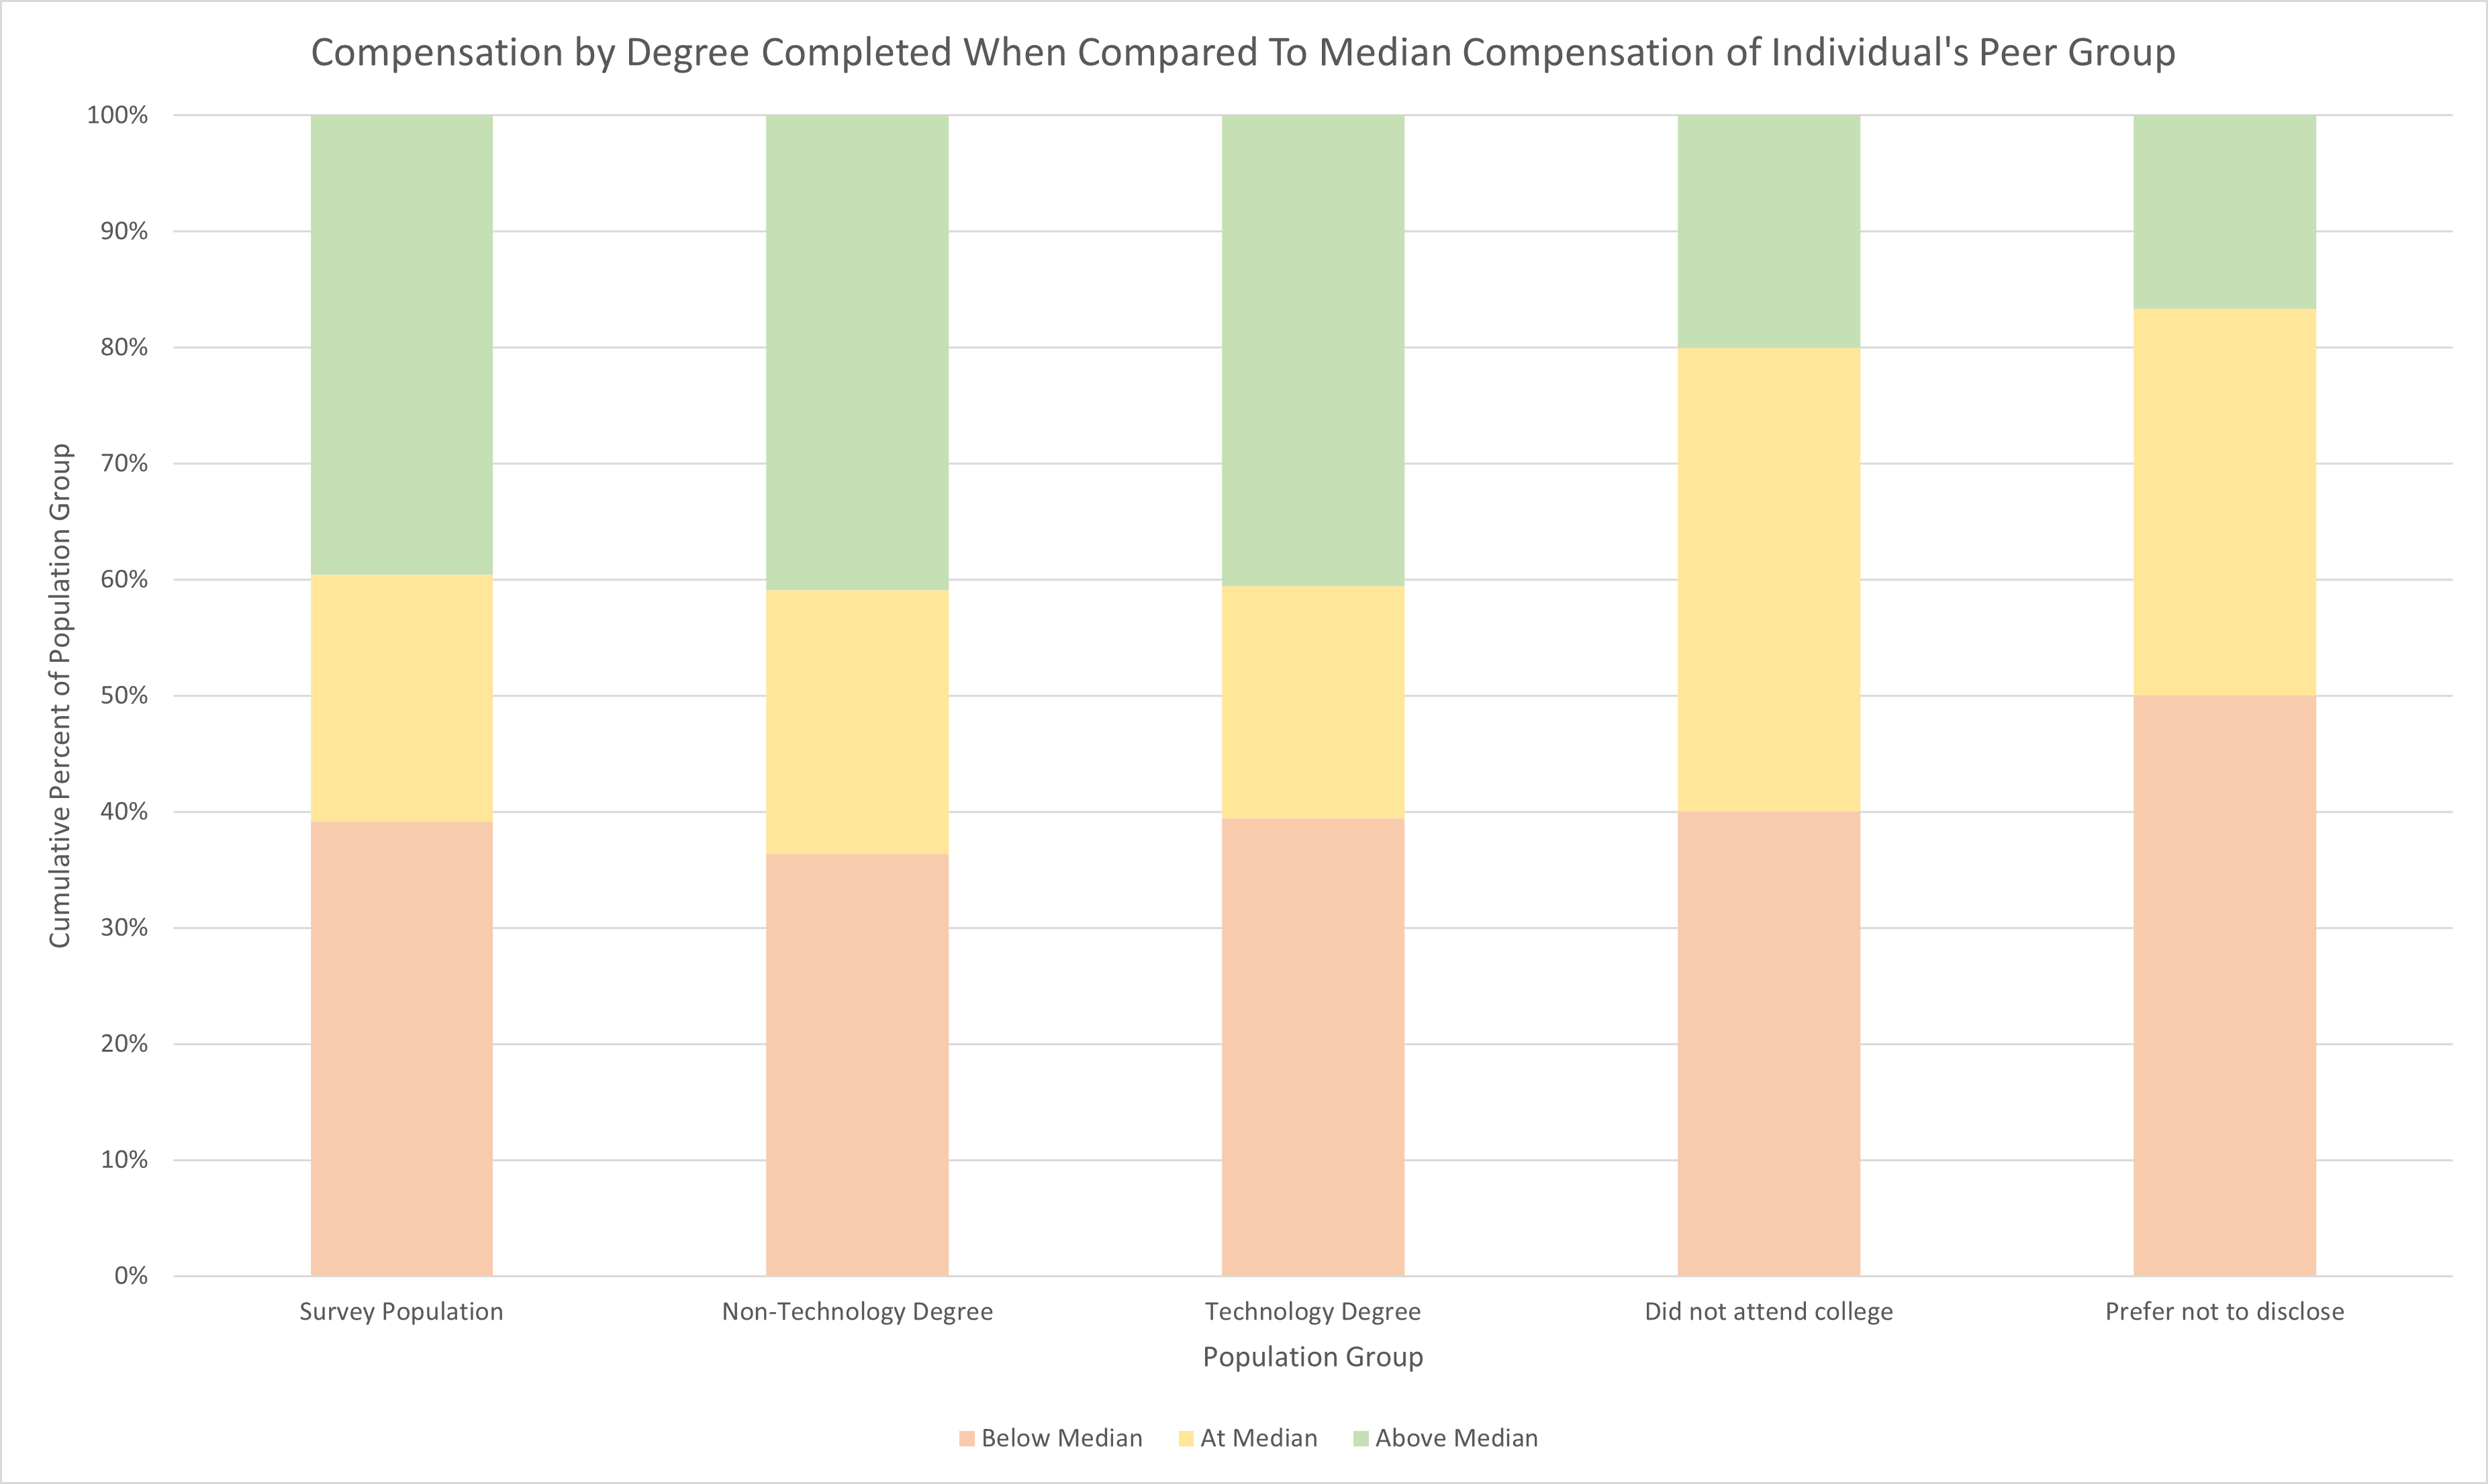
Highest level of education completed is ranked 28th out of 92 features in terms of importance in predicting compensation. The calculation method was also biased in favor of features like Education Level with multiple values. It is likely that the importance is actually lower than indicated, despite it already having relatively low importance.